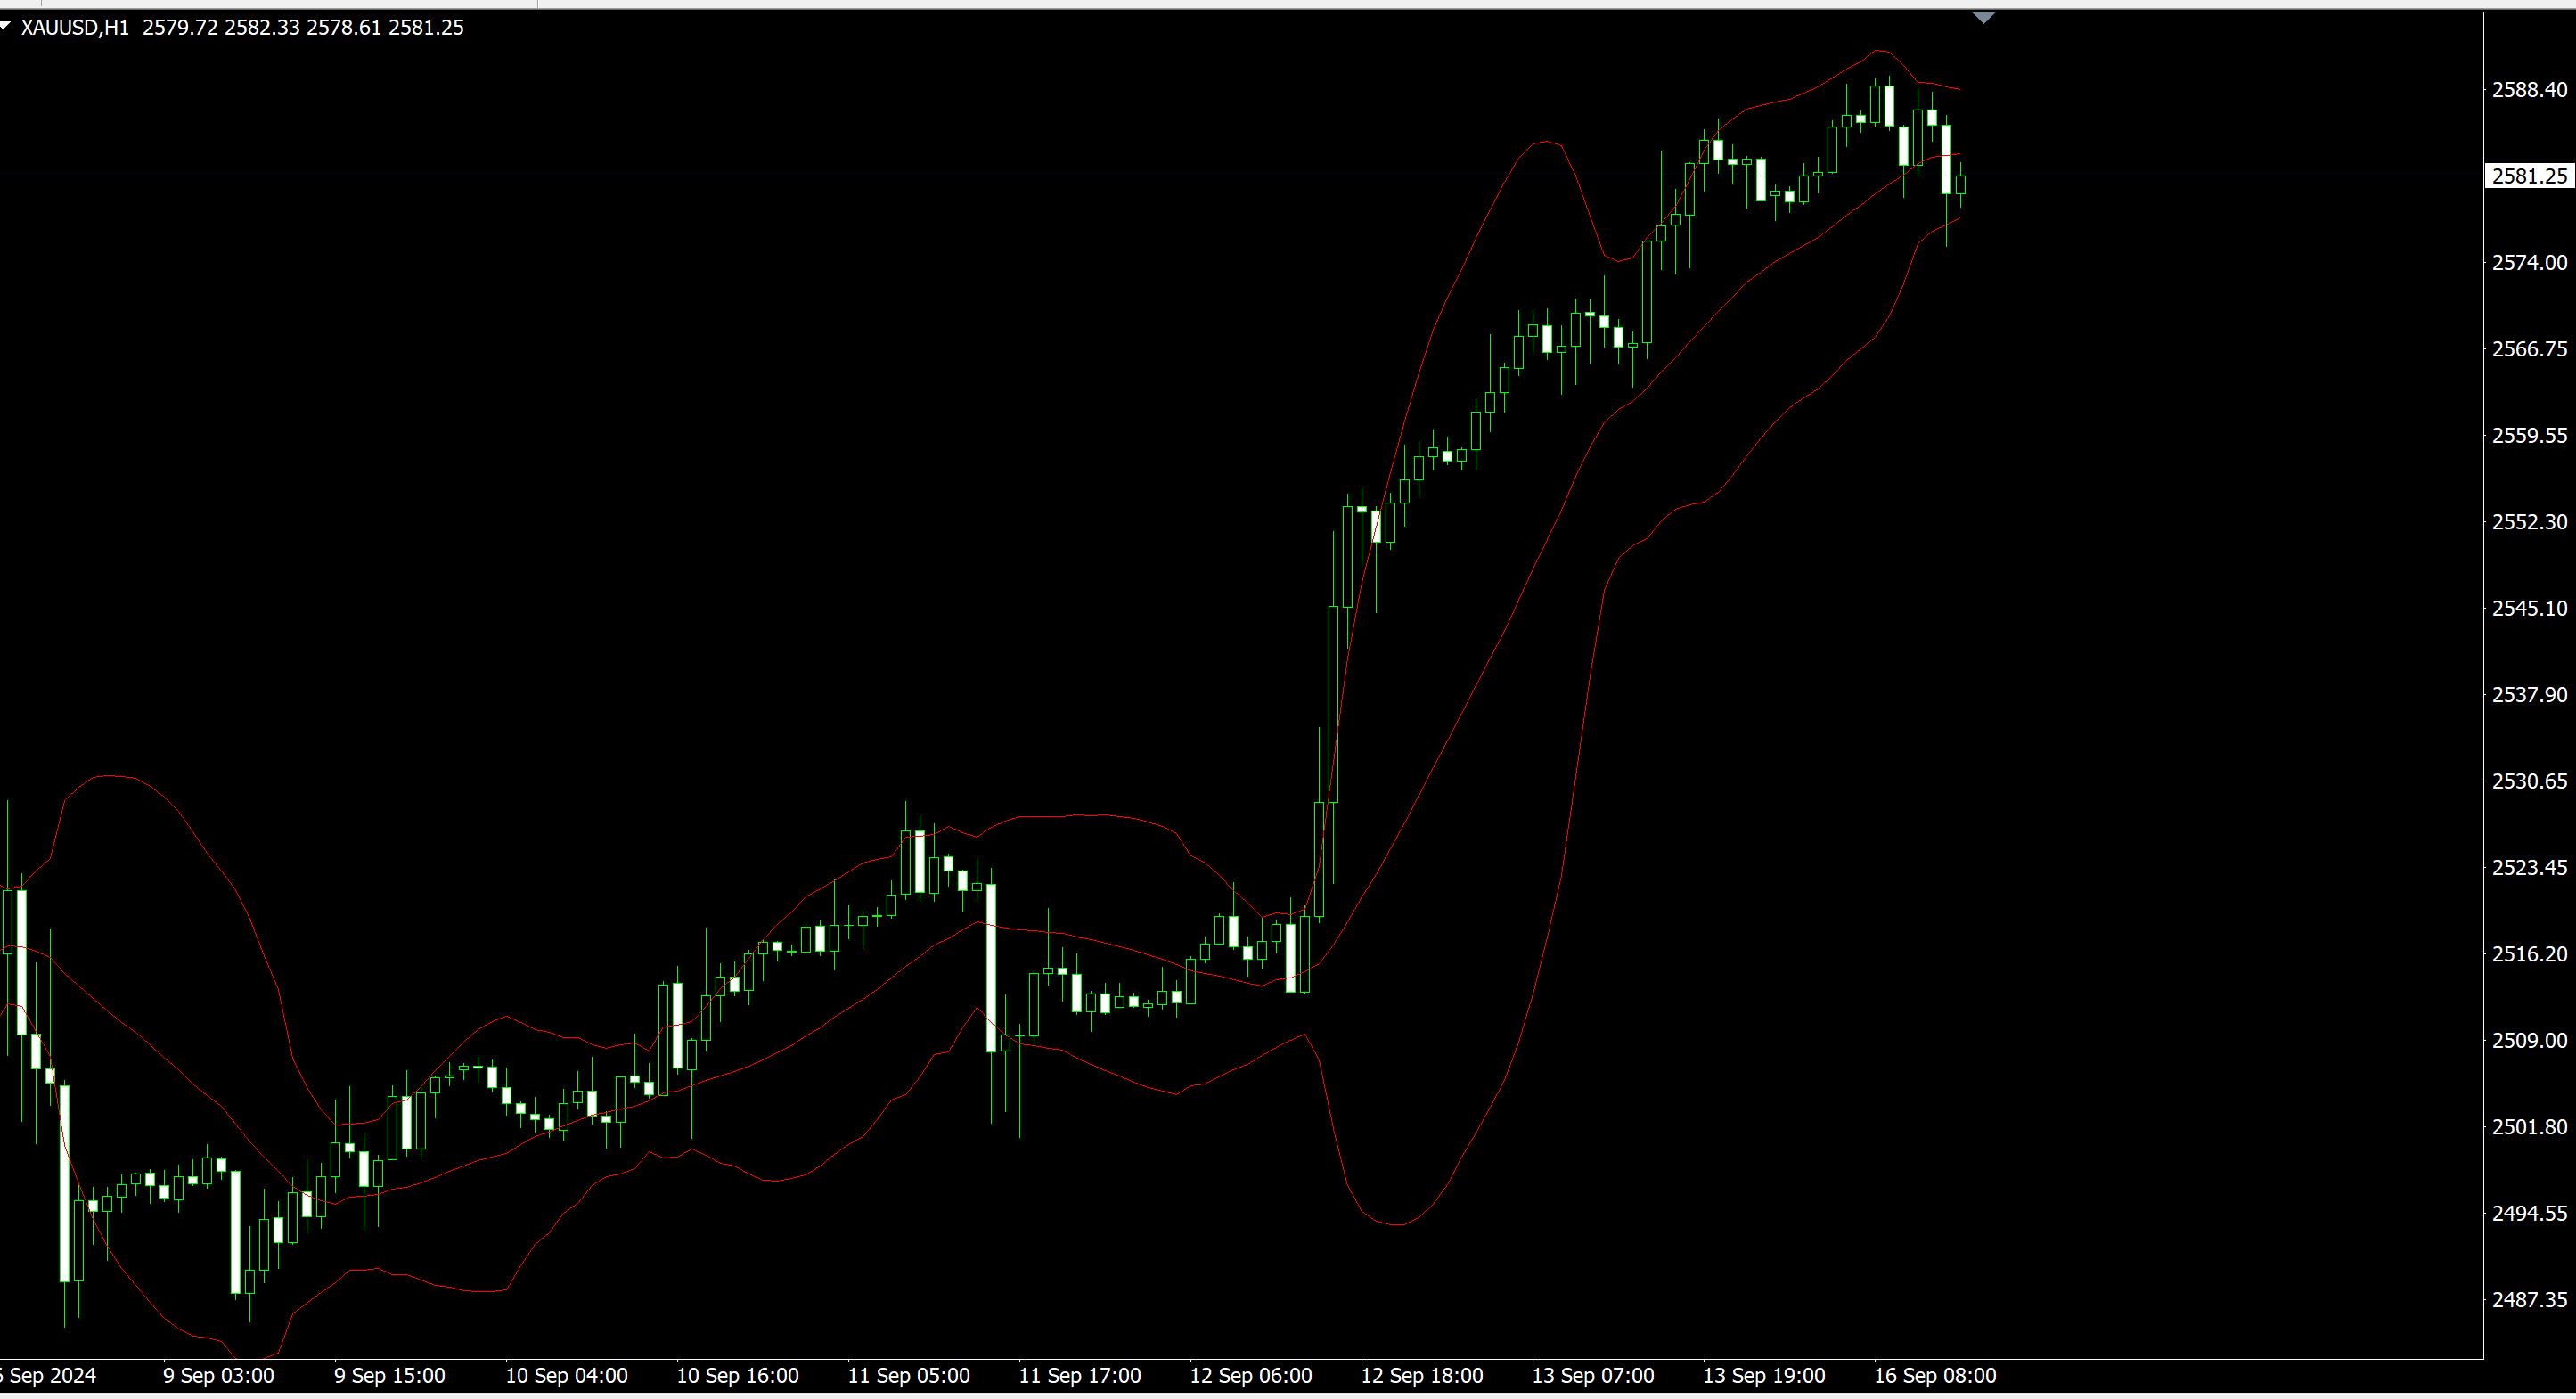
Gold prices hit a historic high, approaching 2600 points
On Monday (September 16th) during the European trading session, spot gold prices surged to another historic high, around $2589.52, with the next major resistance coming from the integer level of $2600. After a strong rebound from around the 20 day simple moving average of $2510, the price has recorded positive buying interest in the past few days.
Technically speaking, the MACD oscillator is expanding its upward trend above its trigger line and zero line, while the RSI is attempting to break through the 70 level. Both are confirming a sharp bullish trend in prices.
The direct resistance comes from the psychological barriers of $2600 and $2700, followed by the 261.8% Fibonacci extension level of $2800 in the downward band of the March 2022 high of $2070 and the October 2022 low of $1616.
If the market weakens and falls below the support of $2531, it may push traders towards $2518, where the 20 day SMA is located, and then stabilize around the long-term uptrend line of around $2483. In addition, the 50 day SMA is located near the previous level, and any drop below that level could turn the outlook into neutral.
In short, this precious metal looks very positive today, setting a new record high, and as long as it remains above the 200 day SMA, the outlook may still be bullish.

Tips:This page came from Internet, which is not standing for FXCUE opinions of this website.
Statement:Contact us if the content violates the law or your rights
