Gold breaks through levels and plummets again, and this week's report from the Federal Reserve may become a dark horse
The gold market last week was basically consistent with our reminder on June 17th. The subsequent confirmation of retracement, significant uplift, and head turning decline were all within expectations. The fundamental news, combined with the "Tai Chi" market trend, returned to the starting point after a week of opening, which continues to suggest that the long short tug of war trend will continue.
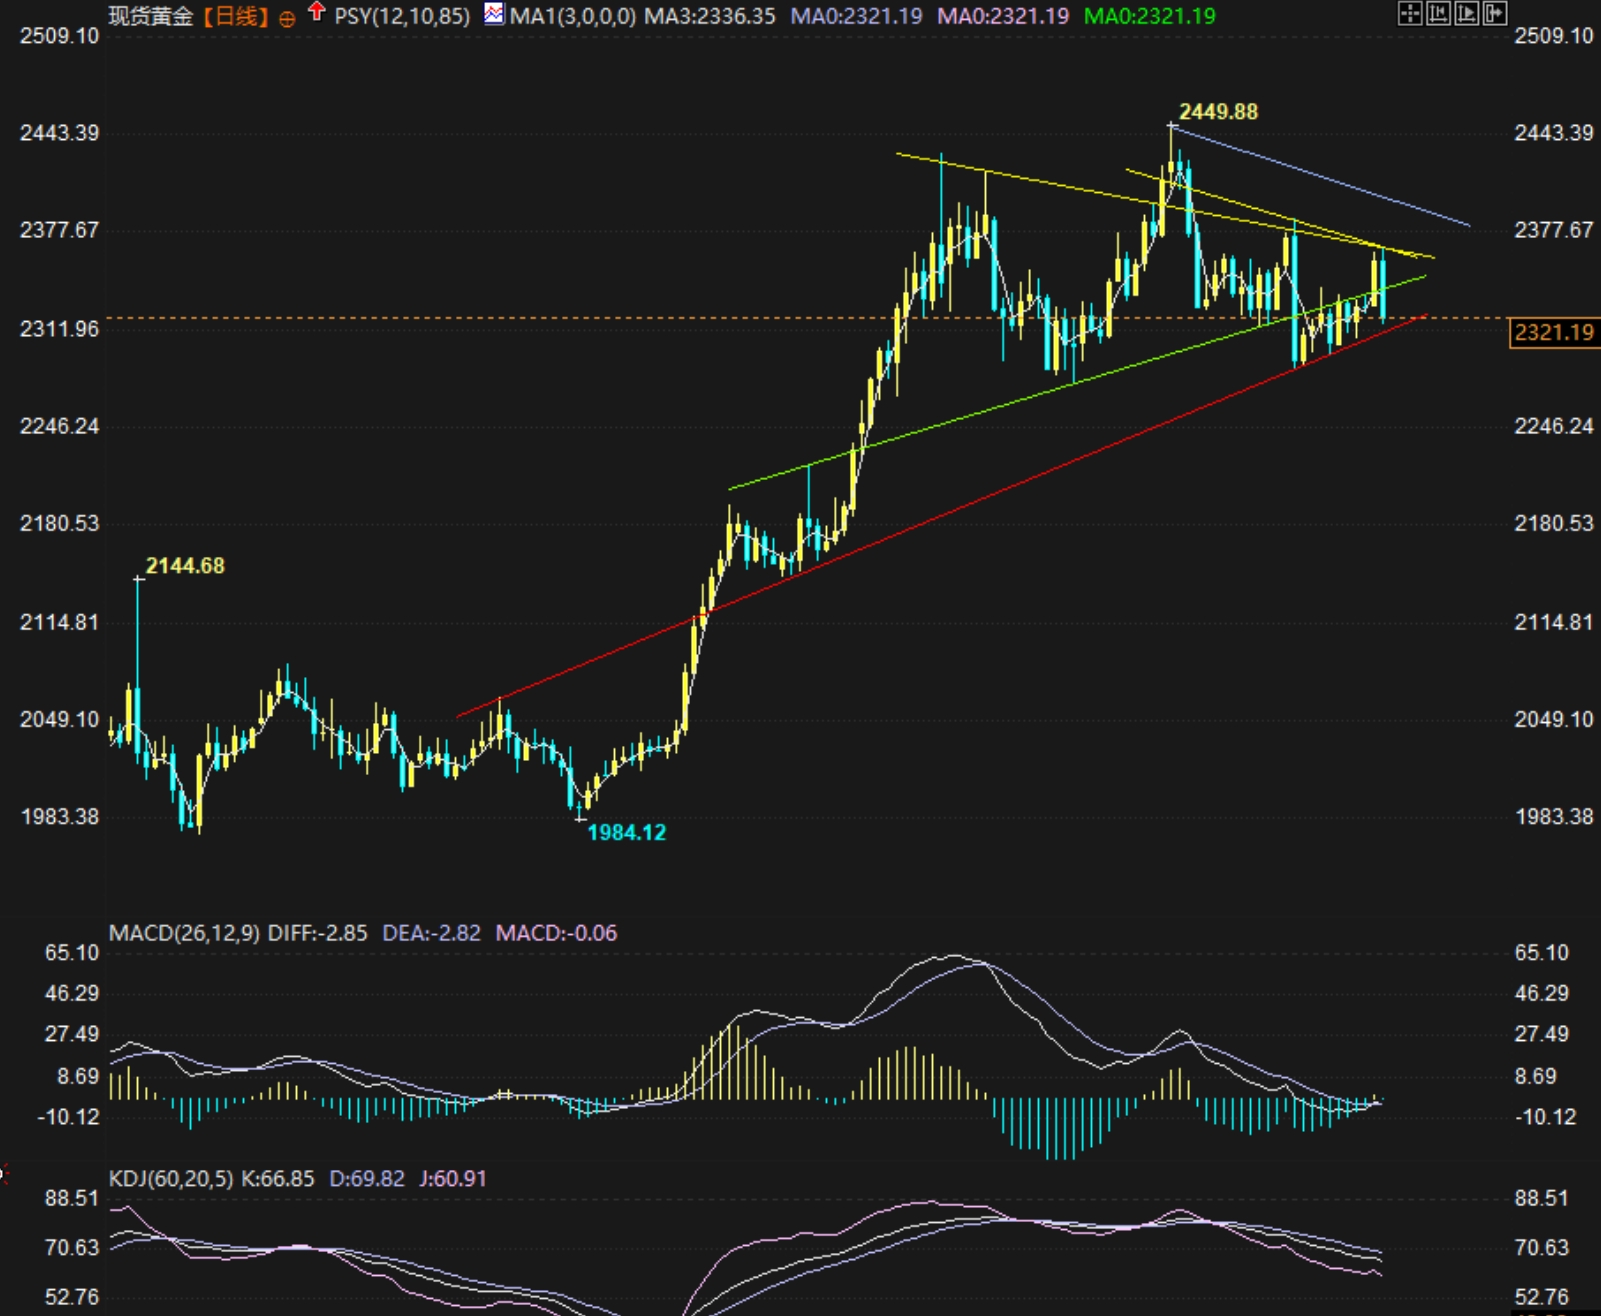
In the morning of June 17, we reminded that gold was "ready to break its position" in the week 0617-0621 (last week), but the overall market was volatile. The actual market was basically the same as the reminder: three days after the shock of last week, spot gold "broke its position" (breaking through the green resistance line of the daily chart) on the fourth day and rose sharply by more than 35 dollars, but fell nearly 50 dollars on the fifth day, and finally closed at the sharp end of the small negative line at 2321.19 dollars/ounce.
Among them, the breakthrough rise that opened on June 20th during the Asian market, followed by confirmation of a retracement, a more significant rise, and the short-term head of the next day, Friday, an explosive decline, were all within expectations. The gold price encountered resistance and fell below 2370, as evidenced by the overlapping resistance of the two "yellow lines" on the gold daily chart below.
The fundamental news is also in line with the "Tai Chi" market trend, with the situation in the Middle East uncertain, and US data fluctuating: last week's release of weak US retail sales, but strong industrial output and manufacturing PMI performance, mixed initial unemployment claims and housing market data. And this trend is expected to continue in the near future.
Technically speaking, the daily chart gold price decisively broke through the green line resistance we reminded us to pay attention to on June 20th, but fell back to near the red support line the next day (which is also a reminder to pay attention to), as if it had returned to its starting point after a week of trading, which continues to suggest that the long short tug of war will continue. According to the rhythm of long short rotation, the gold bulls are expected to take advantage of the opportunity to strengthen after stabilizing at the beginning of this week (0624-0628). If it rises to around 2387, short-term bears may once again gain momentum.
From the 4-hour chart, the gold price quickly fell from 2368.62 to the 2321 line, almost falling from the upper edge of the recent rebound channel to the lower support line in one breath. Pay attention to whether the lower support line of this channel (purple line) can cause the price to rebound, but it should be noted that this lower support has provided two previous supports, so there is a possibility of falling below.
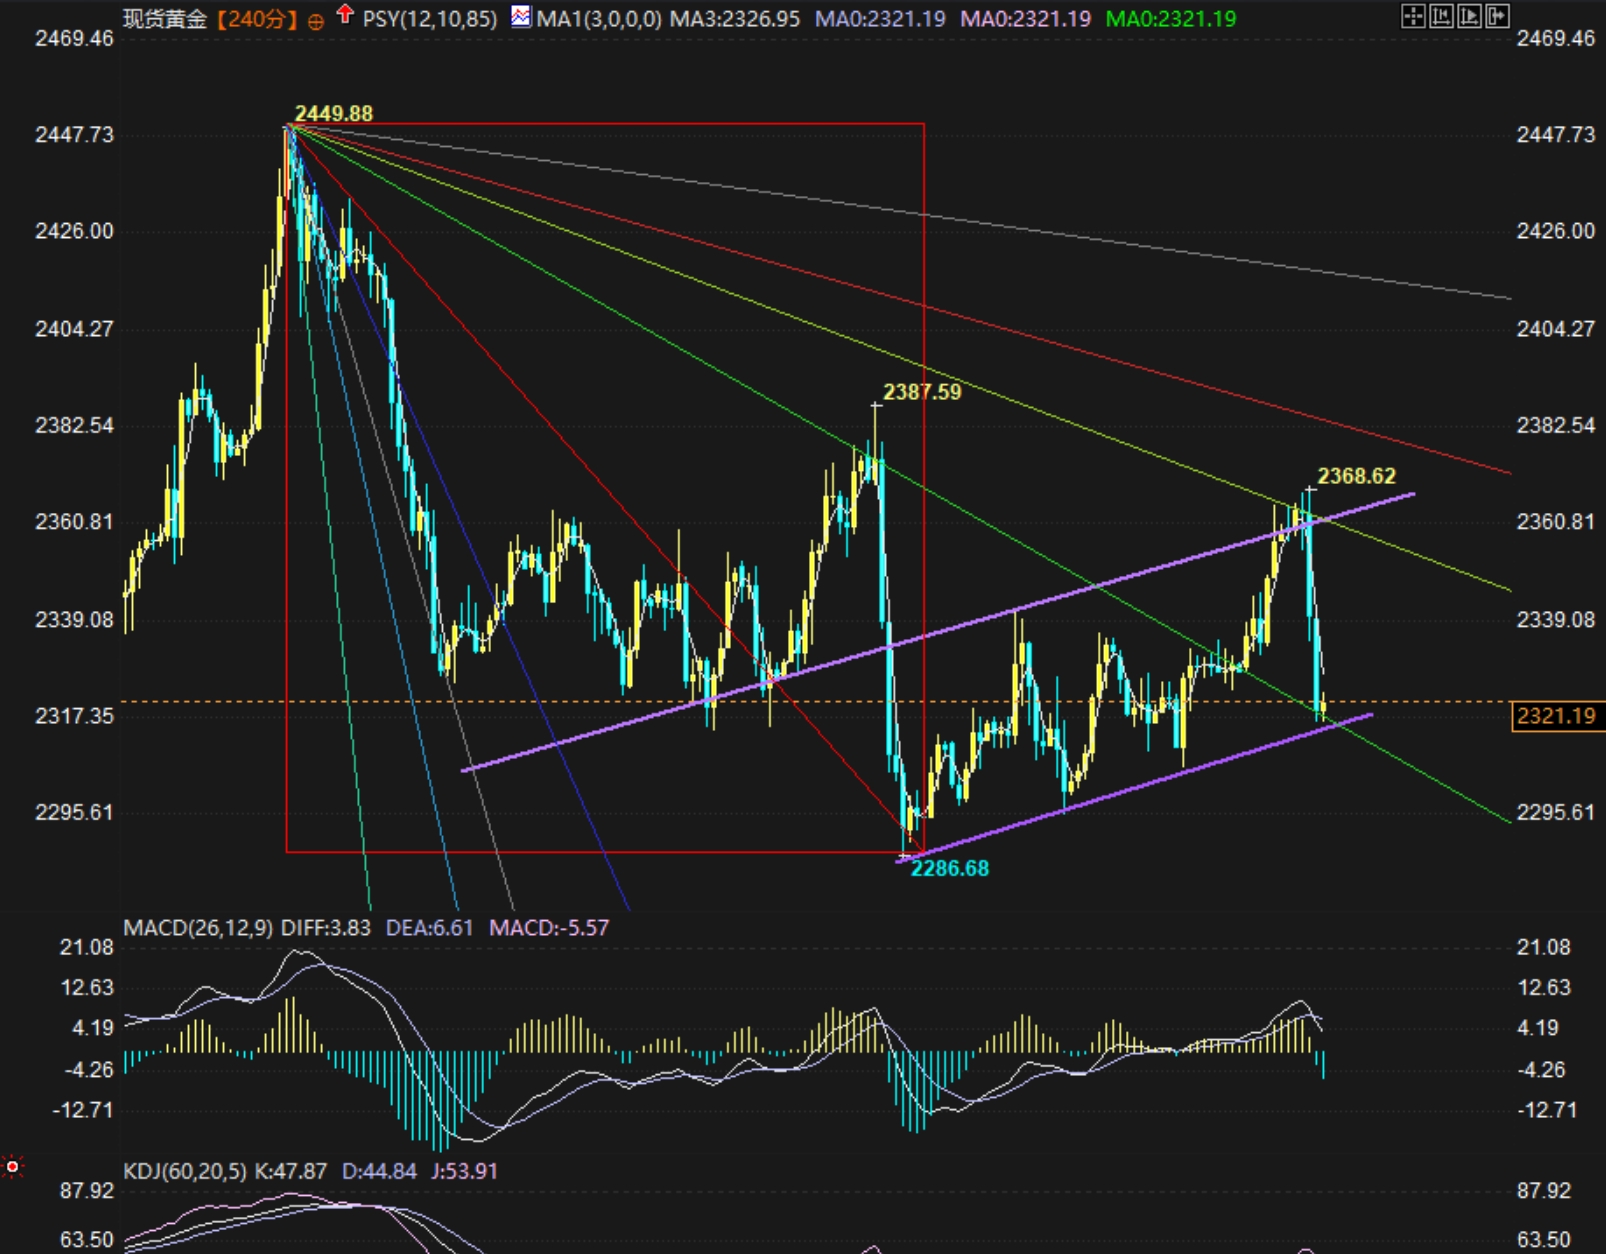
If it falls below the purple bottom support shown in the above picture, the support near the bottom is also relatively dense. Pay attention to 2310-2305, 2300-2295, and then 2286. If there is no significant bearish news, it is expected that the gold price will not fall below 2286 temporarily. If there is a drop, it means that the market has entered a new stage at the daily chart level, and once established, it will accelerate the decline. This is what will happen later. The current initial resistance is focused on 2329-2331, followed by 2336, 2345, 2350, and then the 2356-2368 range. If there is no significant positive news, the probability of gold prices breaking through 2387 this week is relatively low.
If the "mission" of last week's gold price was to test the "green and red lines" drawn on our daily chart, then this week's gold needs to first focus on the angle range formed by the red line and long yellow line on the daily chart above. If there is a break in this range, then the resistance above needs to be focused on 2377 and 2387; If the red line support breaks through, focus on whether to hold onto the 2286 support. If the upper or lower edge of the 2387-2286 interval does not break, then the daily chart level enters a new stage.
In this week's fundamentals, there is also a pile of US economic data, but a report from the Federal Reserve may become a "dark horse" affecting market conditions: on Wednesday in New York time (04:30 on the 27th Beijing time), the Federal Reserve released its annual bank stress test results, which may attract special attention from the market due to the significant pressure brought by the Federal Reserve's high interest rates on banks. If the results show a high proportion of banks that meet the standards, it may raise concerns about the Federal Reserve delaying interest rate cuts, suppressing non US assets such as gold prices. If the stress test results show that a large proportion is at risk, it may trigger predictions that the Federal Reserve will cut interest rates as soon as possible, which will help improve non US assets such as gold prices.
Key focus events for this week (0624-0628)
Monday, June 24th: There are no particularly important indicators, and the market may digest weekend news and make market trends based on technical signals.
On Tuesday, June 25th at 2:00 PM, the first quarter GDP of the United Kingdom, May CPI of Canada at 20:30, and Federal Reserve Director Bowman gave a speech in New York time (02:10 the next day Beijing time).
Wednesday, June 26th: 09:30 Australia May CPI, 14:00 Germany July Gfk Consumer Confidence Index, 22:00 US May New Home Sales, 22:30 US Weekly EIA Crude Oil Inventory. New York time (04:30 Beijing time on the 27th): The Federal Reserve announces its annual bank stress test results (see above for relevant forecasts)
Thursday, June 27th: 17:00 Eurozone June Economic Prosperity Index, 20:30 US Q1 GDP and US initial unemployment claims data, and US durable goods orders
Friday, June 28th: 07:30 Tokyo CPI, Japan unemployment rate, 14:00 German retail, 15:55 German unemployment rate, 20:30 US May personal expenditure and PCE price index and Canadian GDP, 22:00 US University of Michigan consumer confidence.
Tips:This page came from Internet, which is not standing for FXCUE opinions of this website.
Statement:Contact us if the content violates the law or your rights