Gold prices hit historic highs repeatedly, analysts: Fed's interest rate cut cycle begins, bulls will seek to continue current gains
Last Friday (September 20th), spot gold surged nearly $35 and broke a record high. Analyst Nicholas Kitonyi wrote an article last Friday (September 20th) analyzing the future trend of gold.
Kitonyi stated that on September 20th, gold prices rebounded from the key support level of around $2587 per ounce to above $2620 per ounce. In the 60 minute chart, the gold price is trading within an upward channel.
Kitonyi added that gold prices have now risen above the 100 hour moving average. Therefore, the gold price is on the verge of entering the overbought level of the 14 hour Relative Strength Index (RSI).
Spot gold closed up $34.42, up 1.33%, at $2620.91 per ounce on Friday. Gold prices hit a record high of $2625.81 per ounce on Friday.
Spot gold closed up $42.23 this week, up 1.64%.
Will Rhind, founder of GraniteShares Advisors, stated that the beginning of the Federal Reserve's rate cutting cycle means that interest rates are falling and the US dollar will begin to weaken. Rhind said, "This is beneficial for gold. The next stimulus for gold will be that if people feel we are entering a recession and fear factors arise, they need to start buying gold as a hedge
Alex Ebkarian, Chief Operating Officer of Allegiance Gold, said, "The market is considering larger and more interest rate cuts because our finances and trade are both in deficit, and this will further weaken the overall value of the US dollar. If you combine geopolitical risks with our current deficit, low yield environment, and weak US dollar, the combination of all these factors will lead to an increase in gold prices
Forex analyst Fawad Razaqzada released a report stating that "geopolitical risks, such as ongoing conflicts in Gaza, Ukraine, and other places, will ensure the maintenance of safe haven demand for gold
Two pictures to see the prospects of gold technology
In terms of short-term trends, Kitonyi stated that from a technical perspective, according to the 60 minute chart of gold, the price of gold is trading within an upward channel. The 14 hour Relative Strength Index (RSI) supports a short-term bullish trend and is close to overbought.
Therefore, gold bulls will seek to continue the current upward trend in gold prices and rise towards $2654 per ounce, or even higher at $2691 per ounce.
On the other hand, gold bears will seek to take profits when the price of gold falls to around $2587 per ounce or lower at $2551 per ounce.
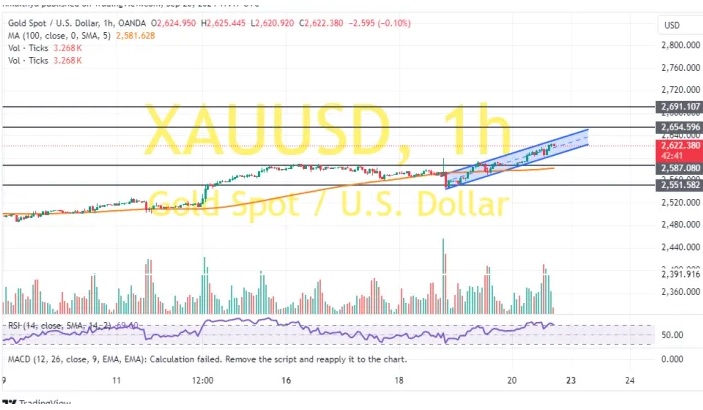
(60 minute chart of spot gold)
Kitonyi pointed out that on the daily chart, gold prices are also trading within the upward channel. On the 14th, RSI supported a bullish trend, and the index is on the verge of entering an overbought state.
Therefore, in the long run, gold bulls will seek to continue the current rebound trend of gold prices and rise towards around $2728 per ounce, or even higher at $2841 per ounce.
On the other hand, bears will seek profit taking when gold prices fall to around $2495 per ounce, or even lower at $2385 per ounce.
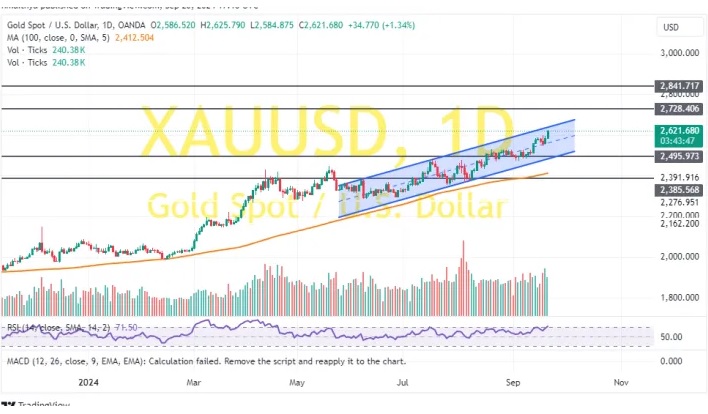
(Daily chart of spot gold)
Tips:This page came from Internet, which is not standing for FXCUE opinions of this website.
Statement:Contact us if the content violates the law or your rights