Japanese yen technology outlook: USD/JPY, EUR/JPY, GBP/JPY
On Tuesday (June 25th) in New York, the US dollar/yen remained stable, trading around 159.720, up 0.08%. The following is a technical analysis of three currency pairs: USD/JPY, EUR/JPY, and GBP/JPY.

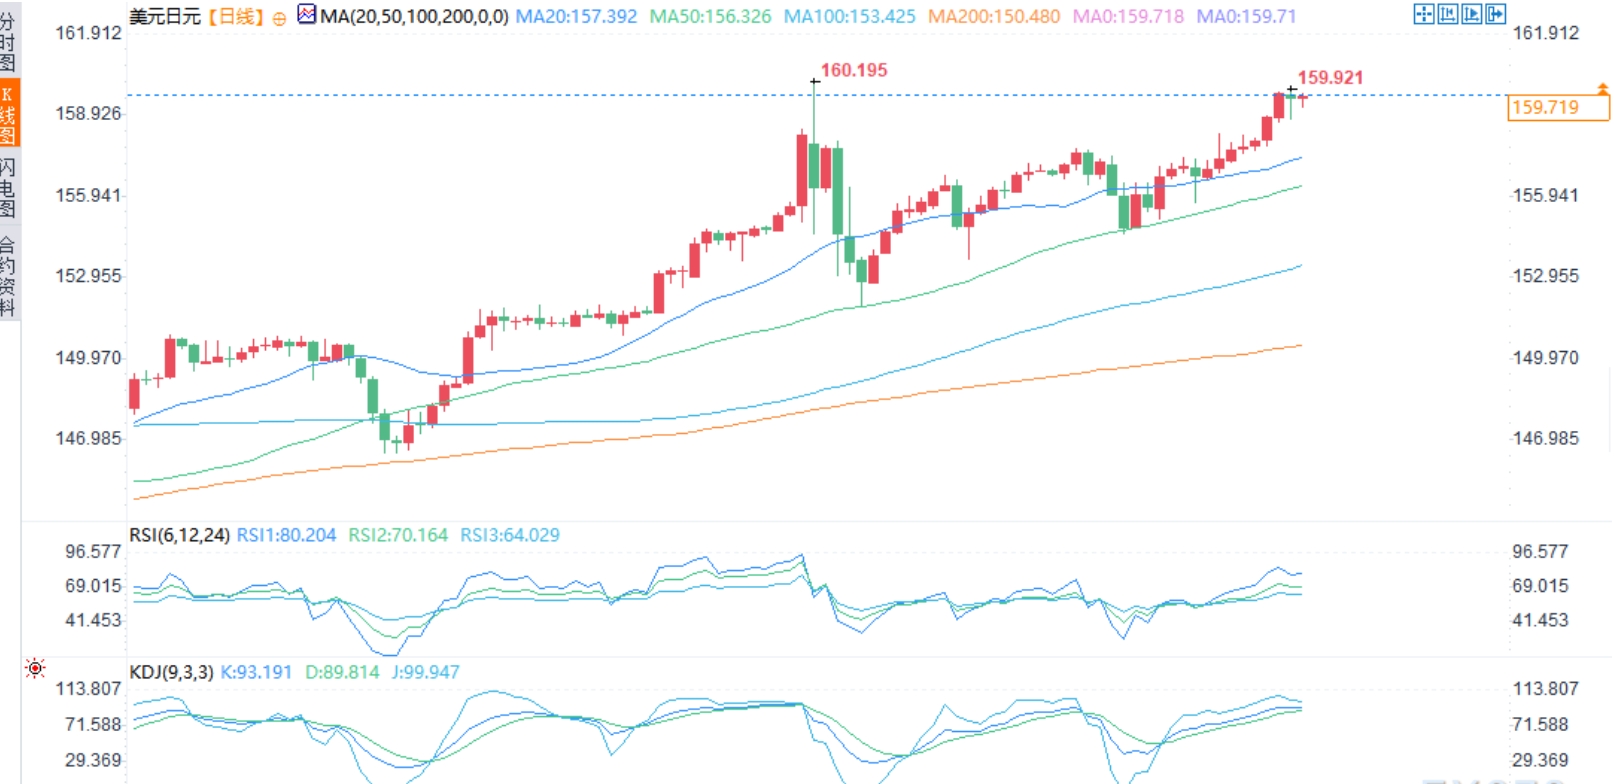
From a technical perspective, the weekly chart shows that the US dollar/Japanese yen closed very bullish last week. This is usually a sign of kinetic energy, and it is also the first time the weekly candlestick chart has closed above 158.300.
On the daily chart, the trend is a bit indecisive. Although the previous week ended in a bullish tone, the gap between the US dollar and Japanese yen narrowed when the market opened on Sunday. Subsequently, earlier in the European market, the US dollar gradually declined, largely due to the weakness of the US dollar rather than the expectation of intervention.
Looking ahead, if the US dollar/yen continues to decline, direct support is at 158.300, and the next key support is at 157.739. Breaking below these levels will open a test of 156.50, and of course, there is also a psychological barrier of 155.000.
On the positive side, the outlook is still more uncertain and there are not many historical price fluctuations to pay attention to. If the dollar/yen is to continue to rise, the first thing to do is to approach the psychological level of 160.00. This will be a huge milestone and may promote further appreciation of the US dollar/yen.
EUR/JPY
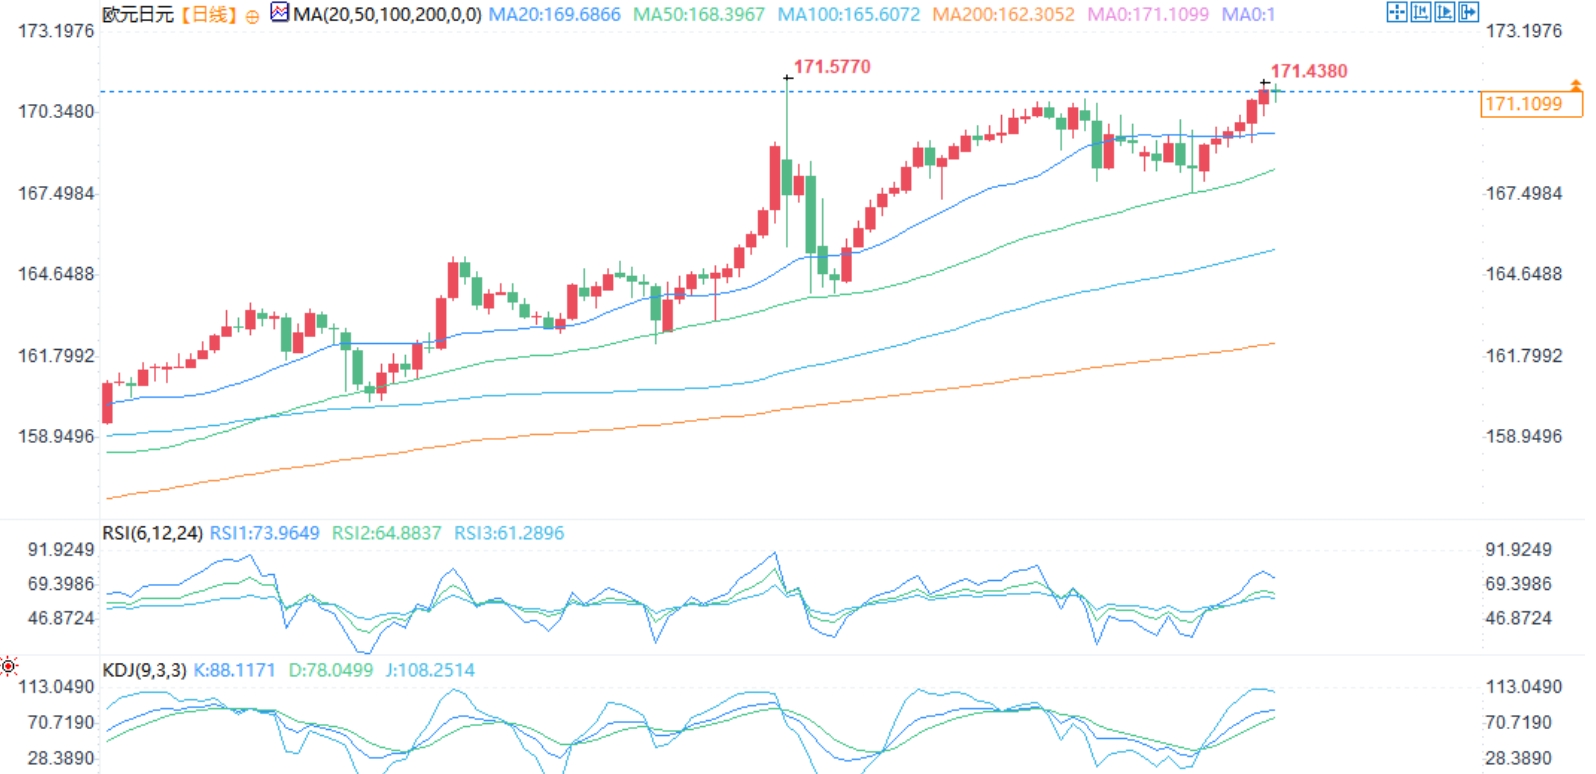
The euro/yen showed a bullish candlestick on the weekly chart, and also closed above the key resistance level of 170.00 last week. The weekly closing appears to have a morning star pattern, suggesting further upward movement.
On the daily chart, similar to USD/JPY, there are not many recent or historical price data above 170.00. Therefore, from a technical perspective, whether the euro/yen will continue to rise may be challenging.
However, starting from here, the retreat must first pass through resistance of 170.00, then turn to the support area, and then focus on the 168.00 level and the 100 day moving average of 165.63.
GBP/JPY
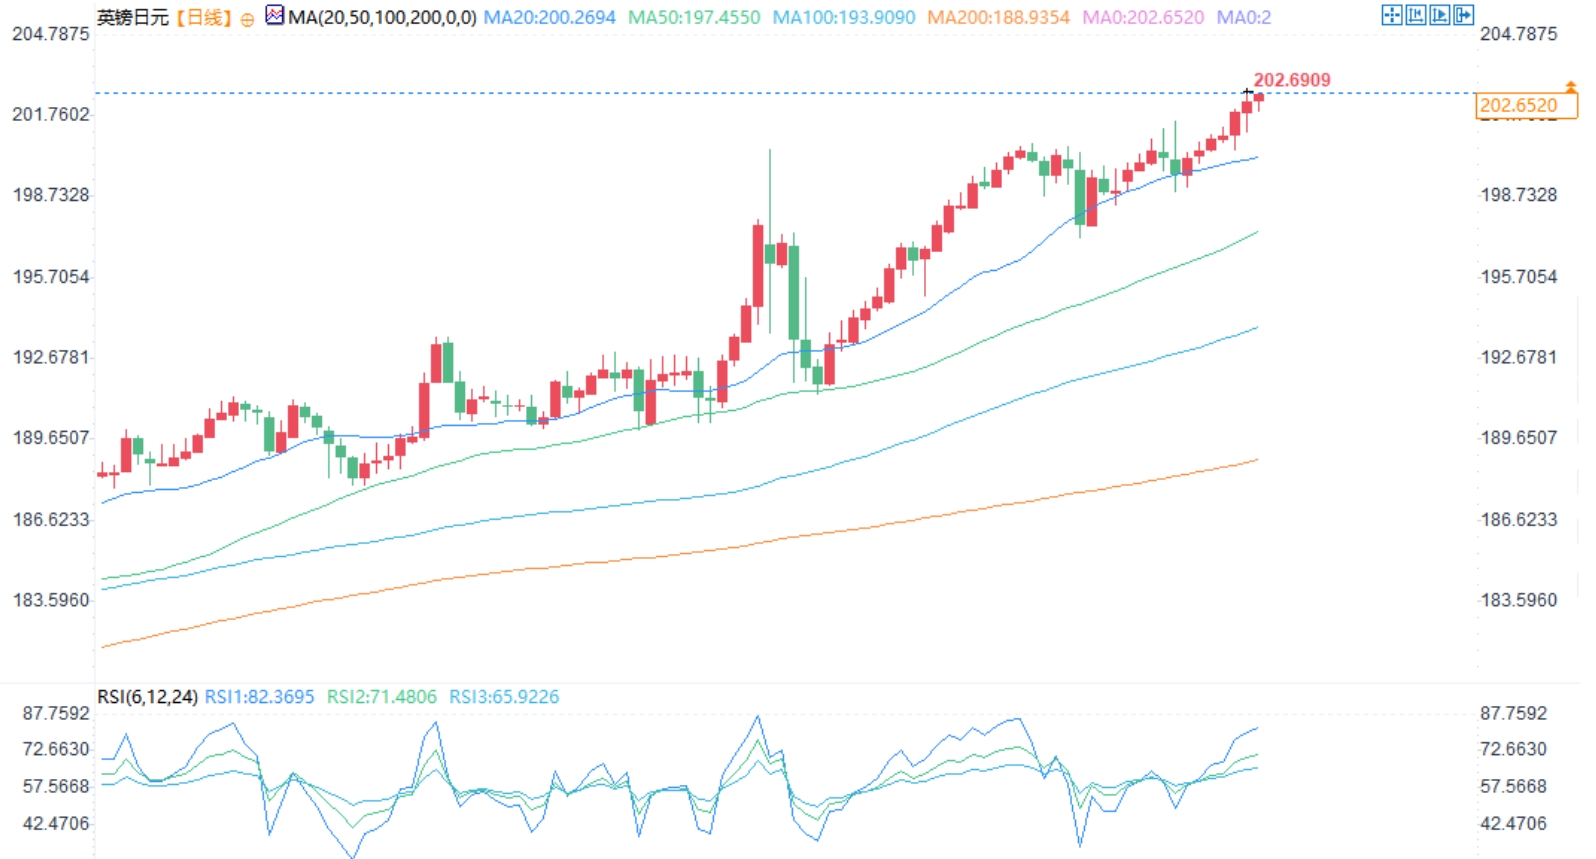
The weekly time frame of GBP/JPY corresponds to last week's bullish candlestick. The weekly chart also convincingly closed above 200.00, having only been closed once before (the last week of May). This may prove to be important, as swallowing the candlestick implies some gains in the coming week.
The main difference between EUR/JPY, USD/JPY, and GBP/JPY is that GBP/JPY actually has some historical price fluctuations, which we can measure above the 200.00 level. Overall, before the psychological barrier of 205.00 became the focus, the direct resistance was at 203.86.
There is also an upward wedge shape, falling below which may cause prices to extend downwards. Breaking below 200.00 will initiate a retest of the 50 day moving average, which is located near the lower end of the wedge at 197.50, and the 100 day moving average will further decline to 193.90.
Tips:This page came from Internet, which is not standing for FXCUE opinions of this website.
Statement:Contact us if the content violates the law or your rights