Technical analysis of GBP/USD, USD/JPY, and USD/CHF on September 26th
On Thursday (September 26th) during the European trading session, the US dollar index fell during the session, closing at 100.7897/997, a decrease of 0.13%.
After Federal Reserve Governor Adriana Kugler stated on Wednesday that she fully supports a 50 basis point rate cut, the US dollar began to decline and investors' attention shifted to the US labor market.
Later today, Federal Reserve Chairman Jerome Powell and New York Federal Reserve Bank President Williams will deliver speeches. The market expects a 62% chance of a 50 basis point rate cut, and dovish Fed spokespersons may increase their bets on a rate cut.
Investors will also pay attention to the number of unemployment claims in the United States, especially as the focus shifts from inflation to the job market. Any unexpected increase in the number of people applying for unemployment benefits could lead to a decline in the US dollar.
The following is a technical analysis of three sets of US dollar currency pairs: GBP/USD, USD/JPY, and USD/CHF.
GBP/USD difficult to further rise
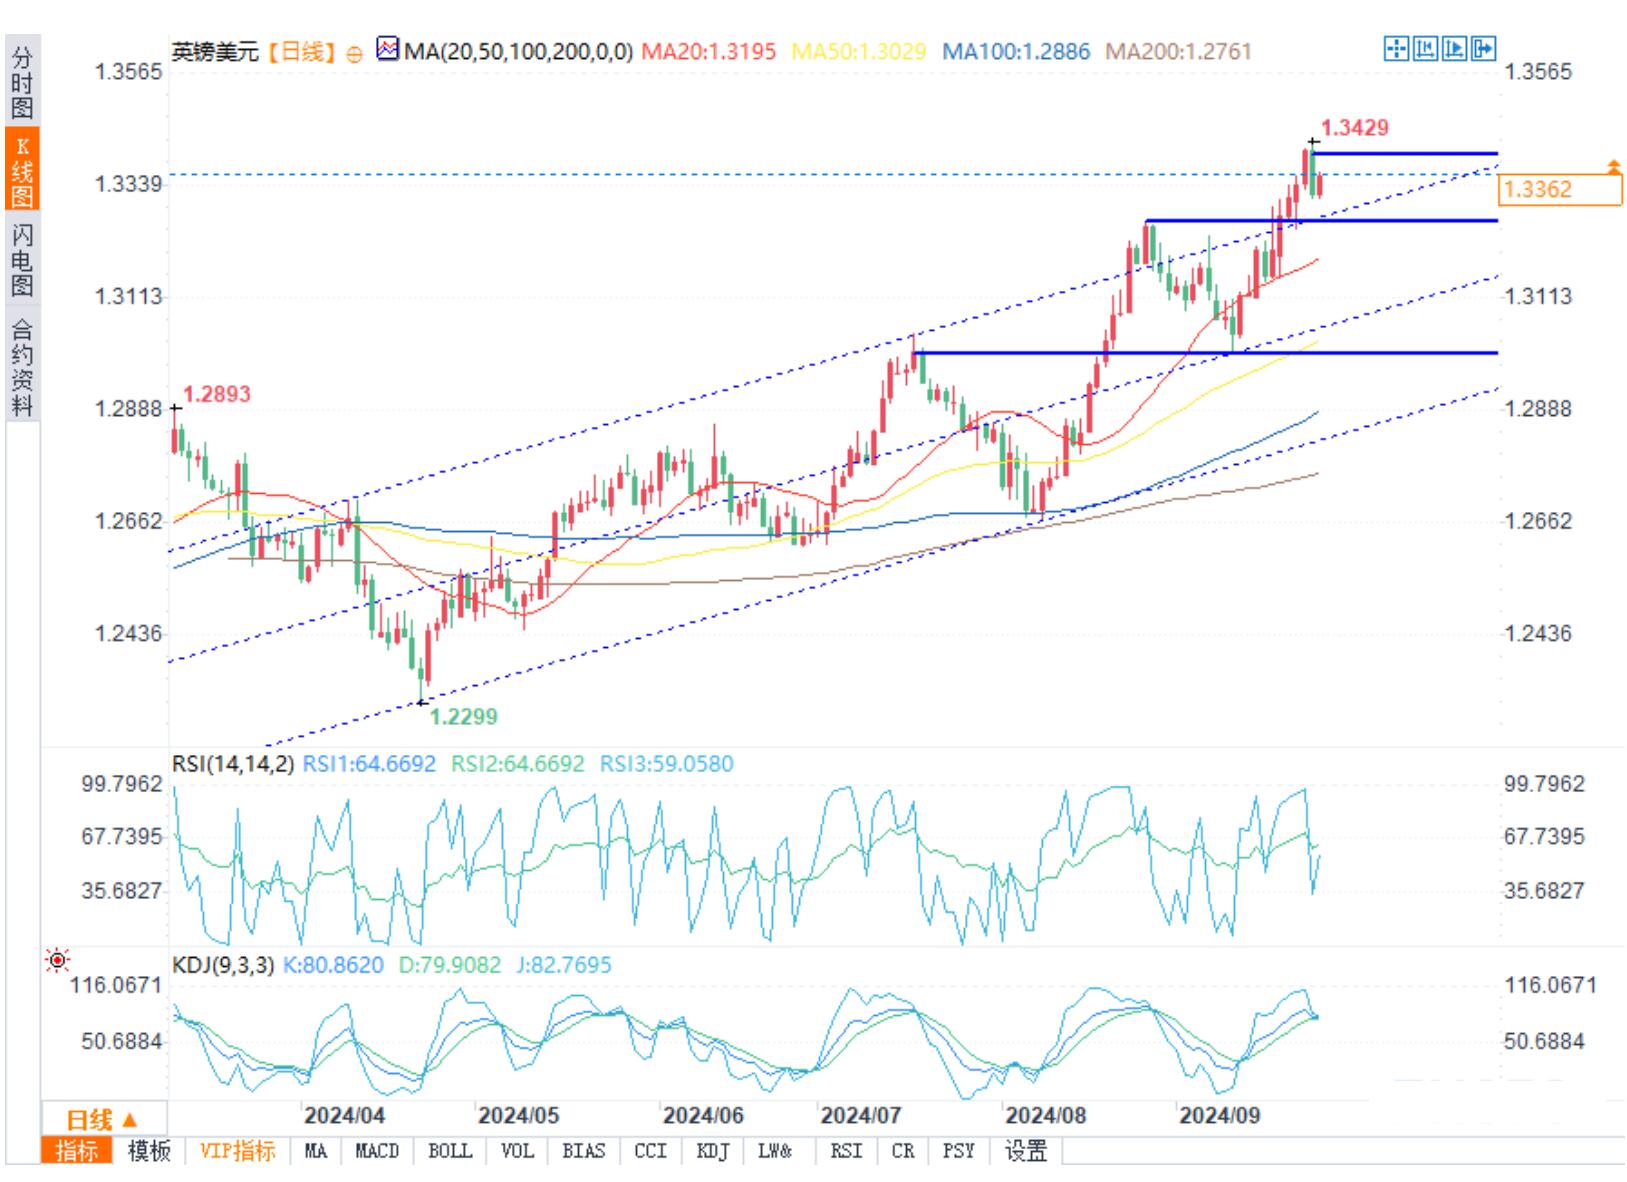
(GBP/USD daily chart)
Due to the rebound in market sentiment, the GBP/USD stabilized after weakening yesterday. Investors' attention is shifting towards next month's budget and the Bank of England's interest rate decision in a few days, making it difficult for the pound to further rise.
Since the end of April, the GBP/USD has been on an upward trend, forming a series of higher highs and lower lows. The price encountered resistance at 1.34 and has been revised downwards. The buyer will seek to break through 1.34 in order to make 1.35 (integer) work.
On the downward trend, the support level is at 1.3265, which is the high point in August. If the exchange rate falls below 1.31, integers begin to take effect, and falling below 1.30 will create a lower low point.
USD/JPY experiences a critical daily reversal
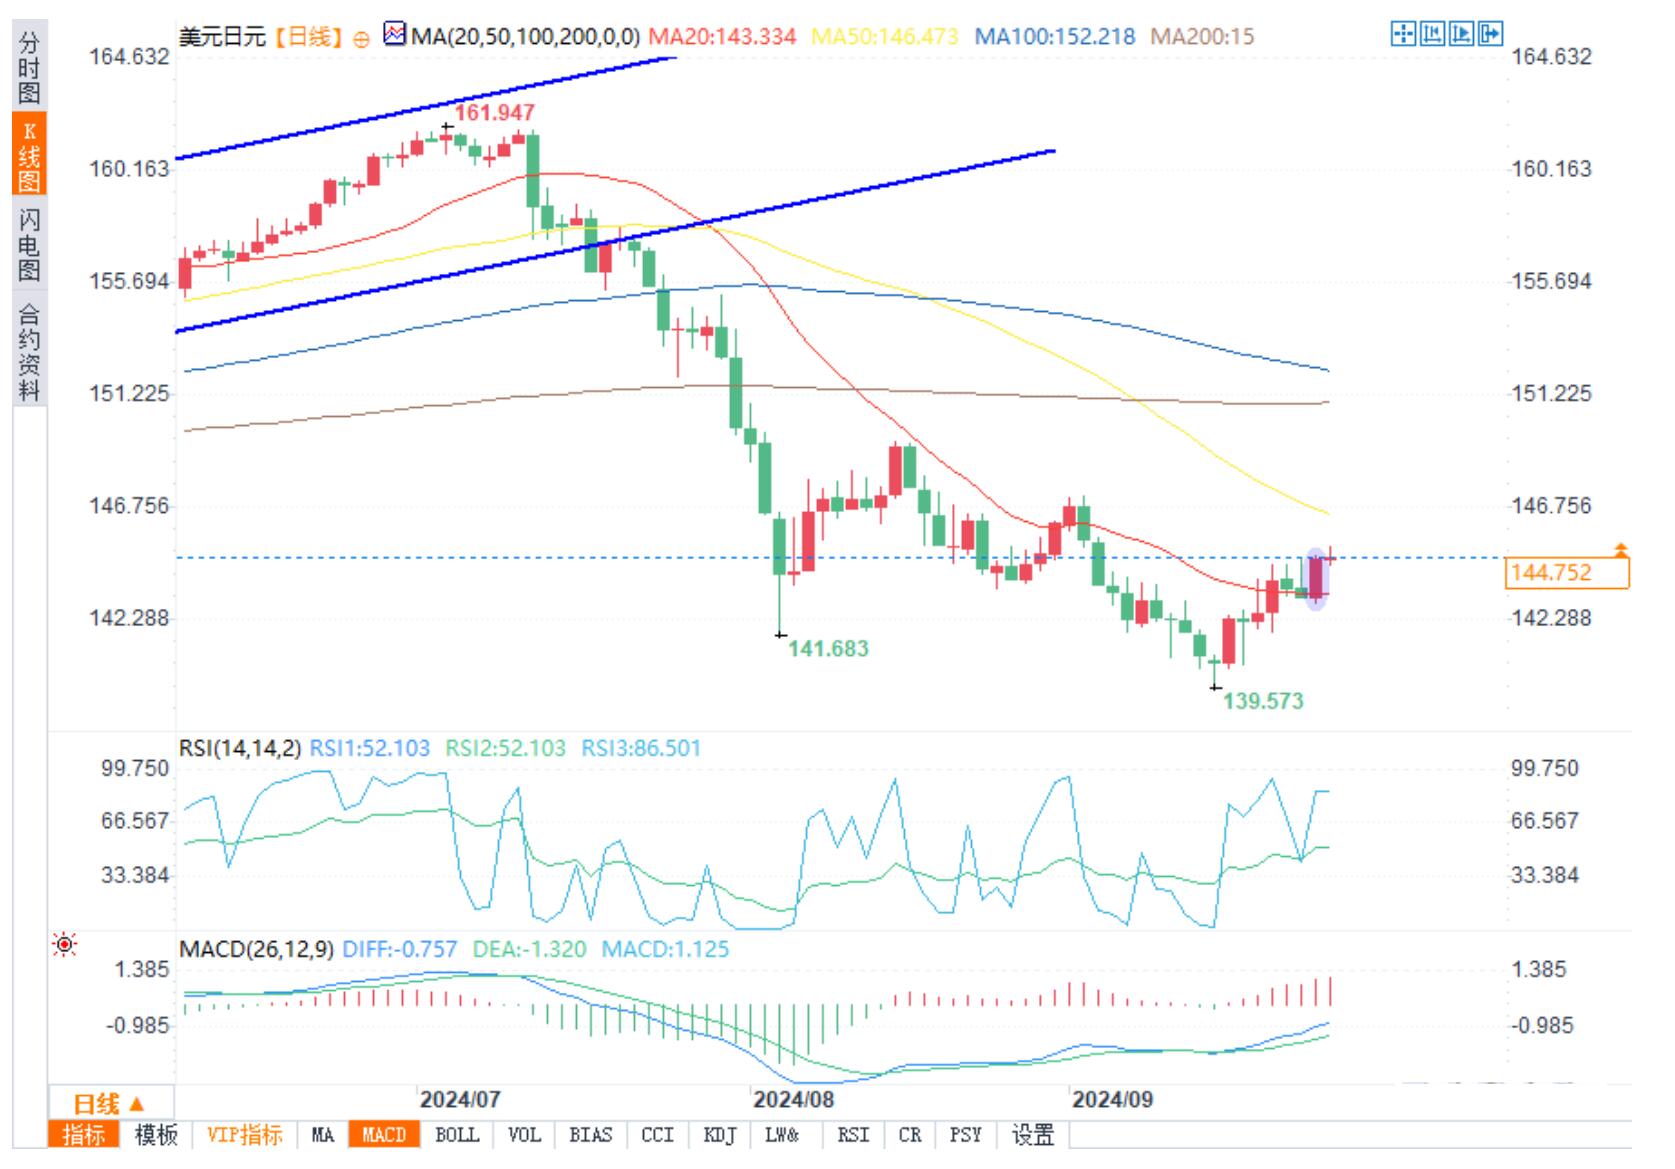
(USD/JPY daily chart)
On the daily chart, Wednesday's trend brought a crucial bullish reversal, with prices breaking through the resistance level of 144.50, providing a useful level for establishing trading settings. Due to the bullish signals generated by MACD and RSI (14) on the momentum, unless we receive clear price sell signals, the trend is still buying on dips.
If we see the exchange rate retesting and rebounding to 144.50 today, we can consider implementing strict stop loss below that level for protection. The resistance level may be around 145.54, but the 50 moving average of 146.49 seems to be a more attractive target.
On the contrary, if we see a reversal back to 144.50, you can sell and set a stop loss on it for protection. Wednesday's low point around 143 is a support level, while 140.273 is another support level.
USD/CHF breaks through high levels
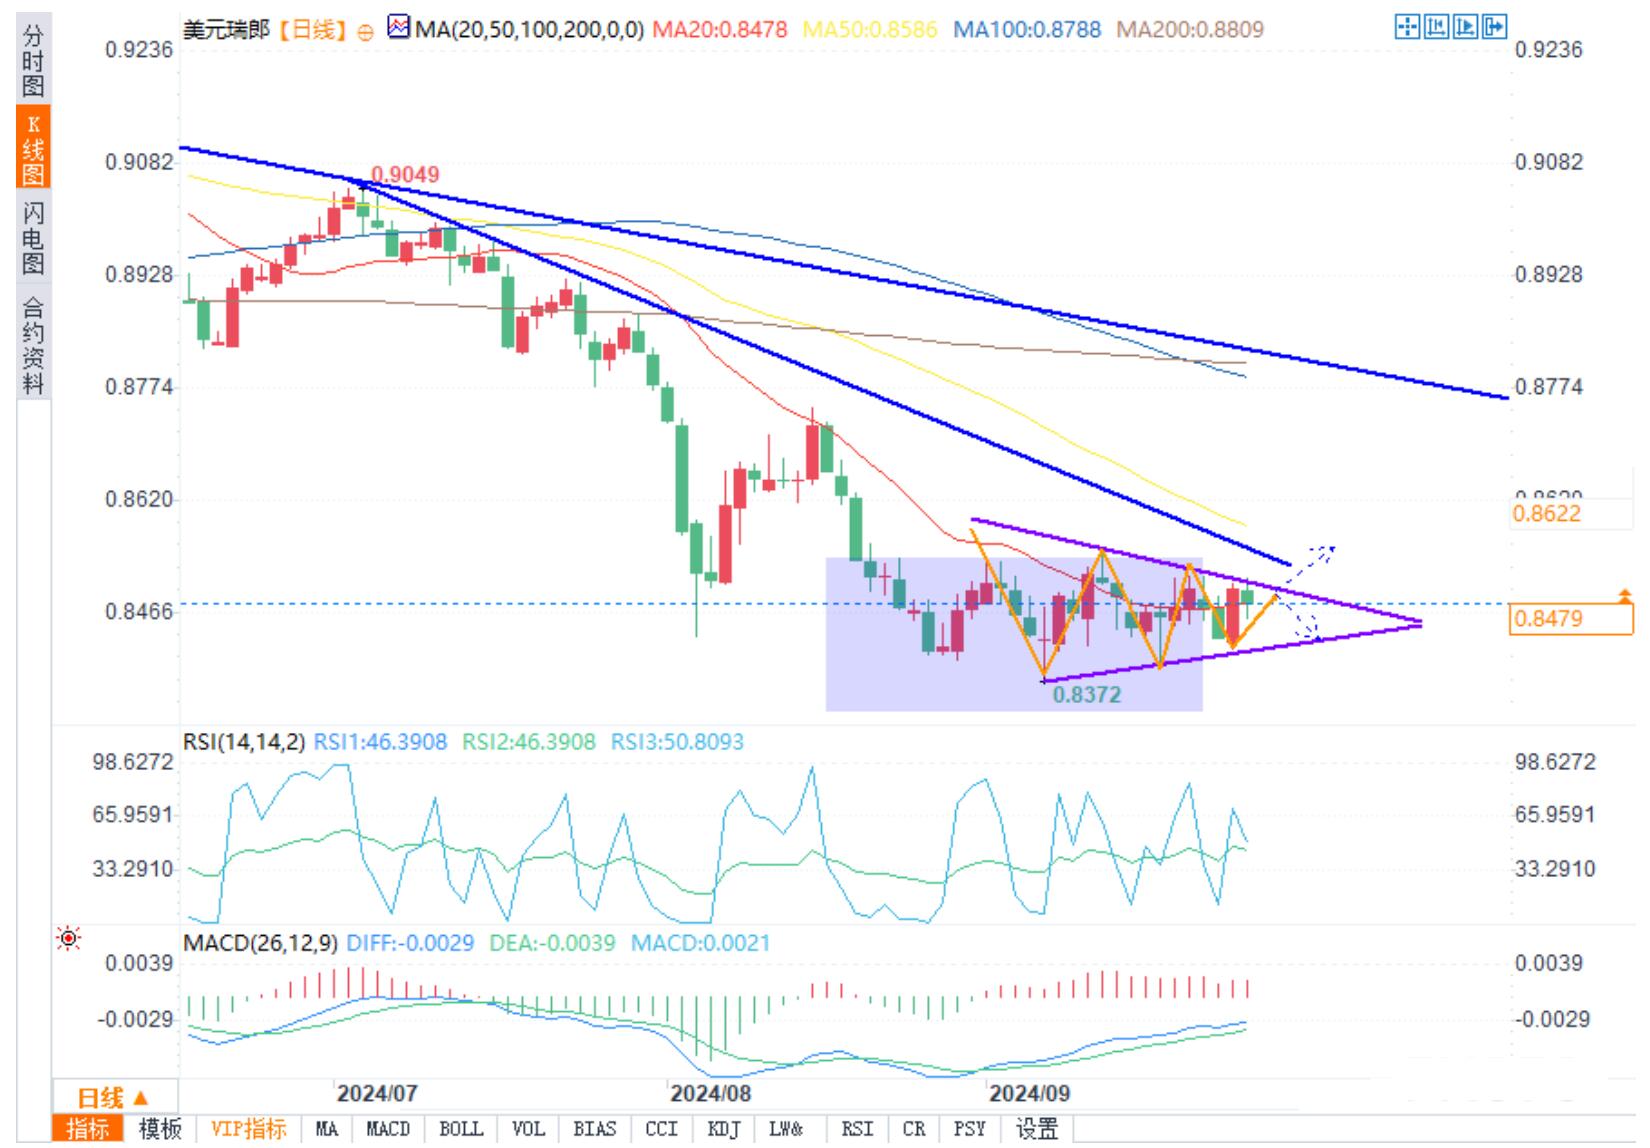
(USD/CHF daily chart)
Like the US dollar/Japanese yen, the US dollar/Swiss franc also experienced a crucial bullish reversal on Wednesday, breaking through the triangular pattern that has been circling since early September. As the MACD and RSI (14) trends rise, it increases the likelihood of an upward breakthrough.
Investors considering going long can buy near these levels, with a tight stop loss level below the front resistance level as protection. 0.8550 is a potential upward target, followed by a 50 day moving average and 0.86171.
If the price falls below the resistance level, you can sell above the tight stop loss and look for a possible position to retest the triangular support level.
Tips:This page came from Internet, which is not standing for FXCUE opinions of this website.
Statement:Contact us if the content violates the law or your rights