PCE data from the United States is coming, which may trigger severe fluctuations in gold prices!
On Friday (September 27th), spot gold remained stable in the Asian market, with gold prices currently trading around $2670 per ounce. On this trading day, gold traders will focus on the US PCE inflation data, which may trigger drastic fluctuations in gold prices.
Analyst Valeria Bednarik wrote an article analyzing the prospects of gold technology.
Bednarik wrote that the gold price remains around $2670 per ounce; The gold price is expected to continue its upward trend, but the risk of a downward correction has increased.
On Thursday, driven by the weakening of the US dollar and geopolitical tensions, gold prices surged significantly.
Spot gold closed up $15.68, or 0.59%, at $2672.23 per ounce on Thursday. The gold price soared to $2685.58 per ounce on Thursday, setting a new historical high.
At 20:30 Beijing time on Friday, the personal consumption expenditure (PCE) price data for August in the United States will be released.
According to authoritative media surveys, the PCE price index in the United States is expected to increase by 0.1% per month in August, and the core PCE price index is expected to increase by 0.2% per month.
The survey also shows that the PCE price index in the United States is expected to grow at an annual rate of 2.3% in August, and the core PCE price index is expected to climb at an annual rate of 2.7%.
The core PCE price index is the Federal Reserve's preferred inflation indicator and the most important economic data of the week, which may provide more clues about the magnitude of the November interest rate cut.
The Federal Reserve lowered its benchmark policy rate by 50 basis points last week to 4.75% -5.00%. Traders expect a 51% chance of a 50 basis point rate cut in November.
Analysts say that if the core PCE inflation index in the United States is stronger than expected, it may pour cold water on the Federal Reserve's bet on a significant interest rate cut in November, thereby hitting gold prices; On the other hand, if PCE data falls below expectations, it may lead people to believe that the Federal Reserve will be more dovish, thereby creating upward potential for gold.
Analyst Eren Sengezer said that compared to earlier this year, investors' concerns about inflation have decreased. However, if the core PCE price index increases by 0.3% or more month on month, it may boost the US dollar. On the other hand, weak data may immediately put pressure on the US dollar.
Short term technical prospects for gold
Bednarik stated that the daily gold chart shows that the low and high points of gold prices continue to rise, supporting another wave of upward movement in gold prices. At the same time, technical indicators are firmly moving upwards within overbought levels and have not yet shown signs of upward drying up. The gold price continues to be higher than the firmly bullish moving average; These moving averages are far below the current level of gold prices. Overall, despite the lack of technical indications, the risk of a downward correction has increased.
Bednarik added that in the short term, based on the 4-hour chart, it is clear that the bulls are still controlling the situation. Gold prices fell during Thursday's trading session near the bullish 20 cycle simple moving average (SMA), which currently provides dynamic support at around $2650 per ounce. At the same time, the 100 cycle SMA and 200 cycle SMA accelerated their upward trend, far below the short-term moving averages mentioned above, reflecting sustained upward momentum. Finally, the momentum indicator slightly rose in the positive area, while the relative strength index (RSI) moderately fell from extreme overbought readings, showing a slight divergence. This divergence may not be sufficient to support a decline in gold prices, but it is the first warning of a possible drop in gold prices in the coming trading sessions.
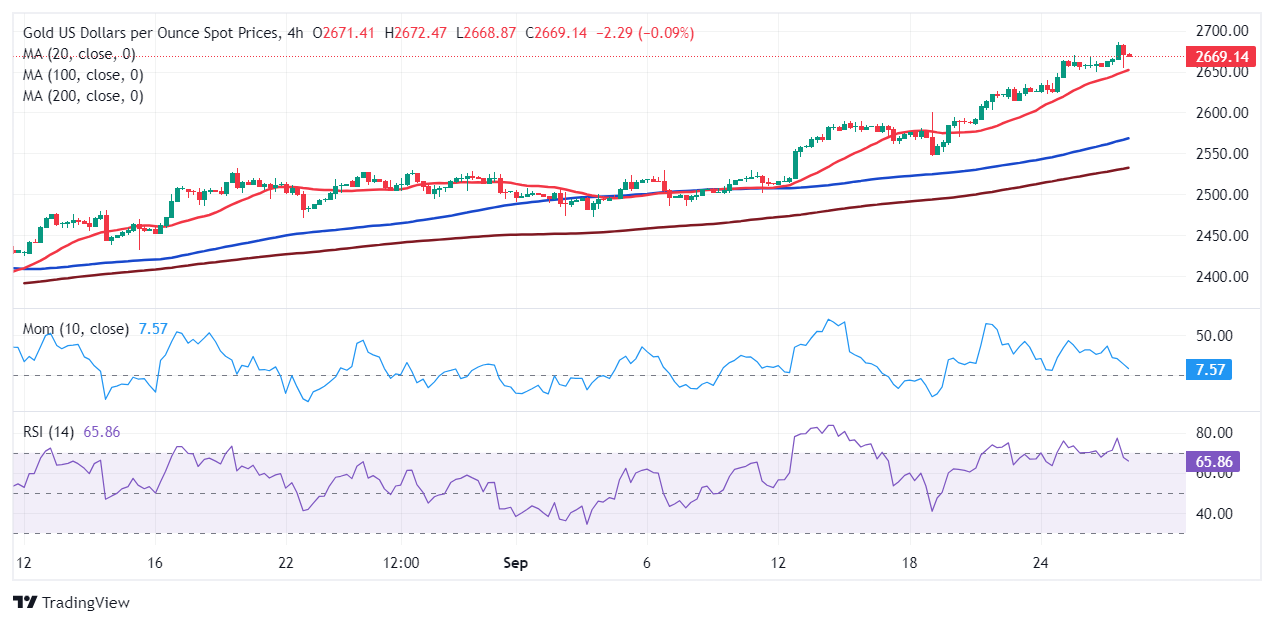
(4-hour chart of spot gold)
Bednarik provides the latest important support and resistance levels for gold prices:
Support level: $2662.80 per ounce; 2650.00 USD/oz; 2638.10 USD/oz
Resistance level: $2685.00 per ounce; 2700.00 USD/oz; 2715.00 USD/oz
Tips:This page came from Internet, which is not standing for FXCUE opinions of this website.
Statement:Contact us if the content violates the law or your rights