Gold price reverses around 2760, analyst: US election uncertainty provides support, short-term trend remains bullish
On Friday (October 25th), the price of gold fluctuated around $2733, silver rebounded to $33.73 after a deep decline, and the USD/JPY fell to $151.93 and fluctuated. The US presidential election is scheduled for November 5th, with significant market uncertainty.
Historically, gold has served as a safe haven asset during periods of political and economic instability. The growing concerns about fiscal deficits, geopolitical tensions, and monetary easing policies have prompted investors to use gold for protection. Recently, the gold price has hit the small resistance zone of $2760 and started to correct downwards.
The market expects that the increase in gold production and recovery levels in the mining industry will increase supply. In addition, due to high prices, the demand for gold in jewelry and coins has decreased, thereby reducing the market's demand for physical goods. On the other hand, the silver market remained strong after breaking through $32.50. This breakthrough caused the silver price to drop to the resistance zone around $34.80. Driven by technological innovation and energy demand, the demand for silver in the industrial sector continues to grow.
Although gold is expected to benefit from election uncertainty, the escalating geopolitical crisis has fueled its bullish outlook. On the other hand, the US dollar index experienced a mild correction, driving the rise and fall of the US dollar/Japanese yen. The increasing uncertainty surrounding the US presidential election has strengthened the position of the US dollar as a safe haven asset for October. At the same time, investors are uncertain about the possibility of the Bank of Japan (BoJ) raising interest rates again after Governor Kazuo Ueda made somewhat dovish remarks.
Here is the latest technology outlook from FXEmpire analyst Muhammad Umair:
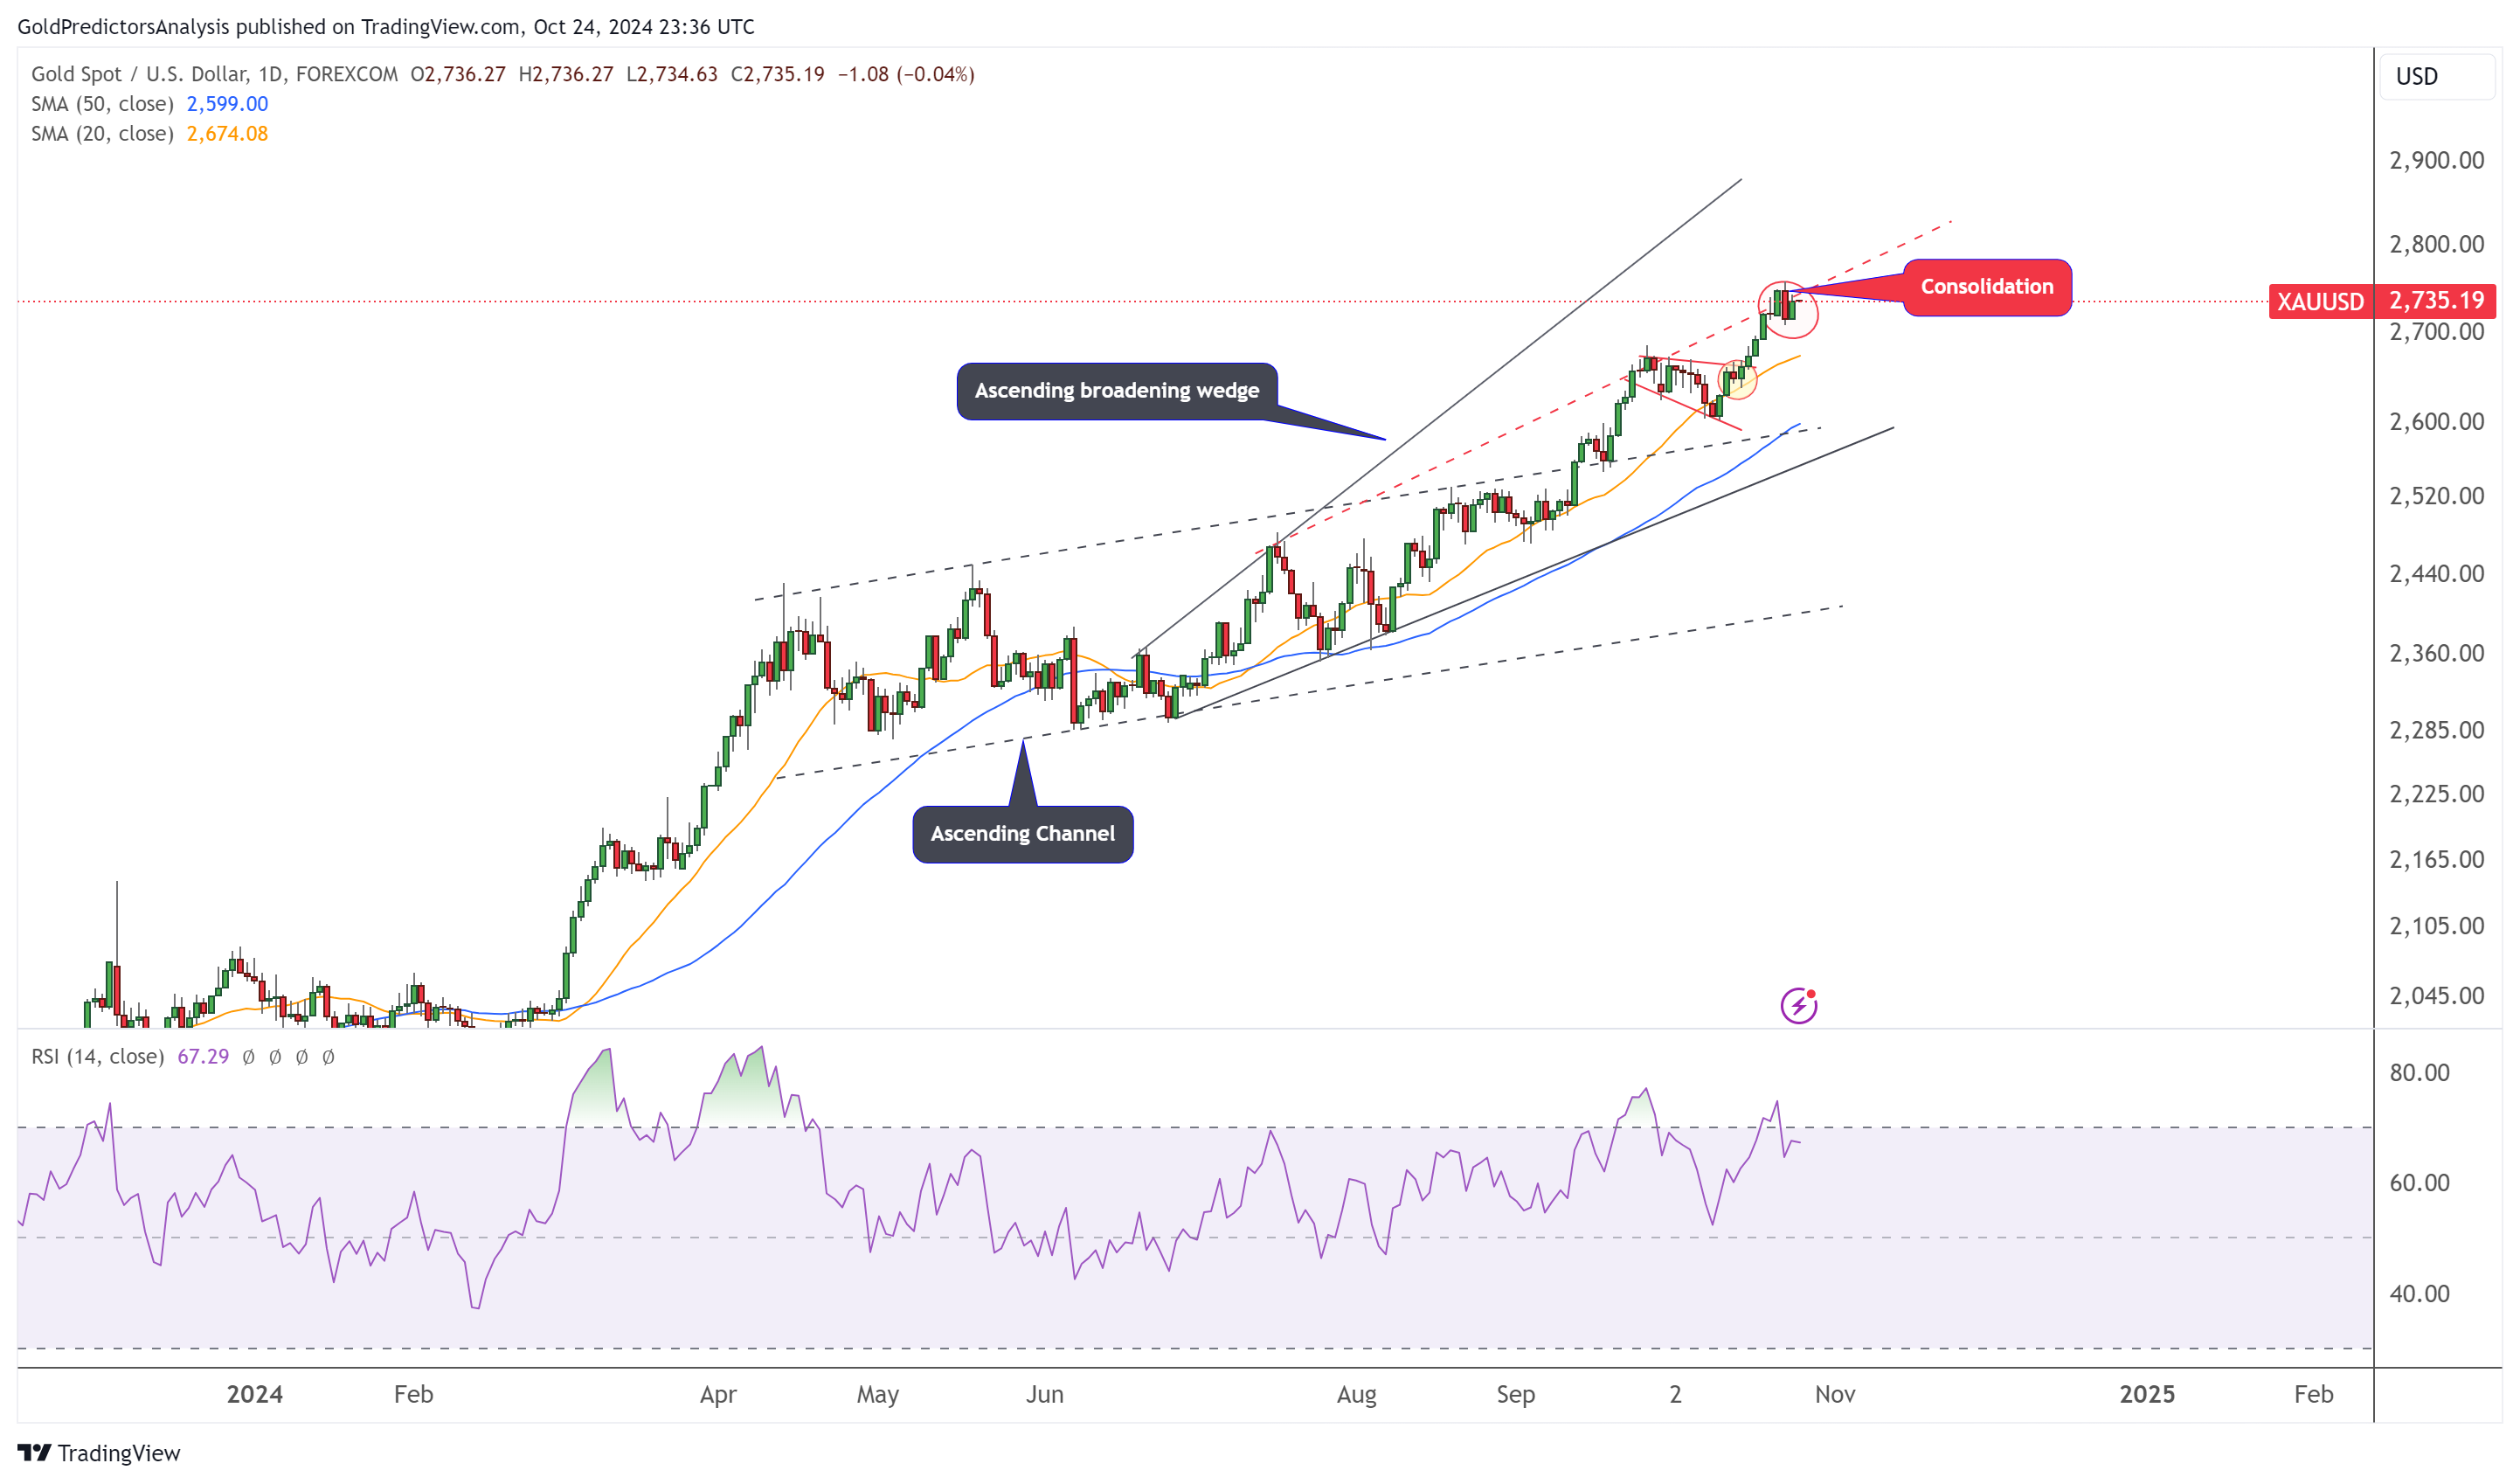
Gold Daily Chart - Consolidation
The daily chart shows that gold has experienced a key reversal from the strong resistance level of $2760. The red dot trend line on the daily chart indicates this resistance level. Prices consolidate after a key reversal. In addition, the RSI on the daily chart shows a bearish divergence, indicating the possibility of weakness.
The strong support level is at the 20 day moving average of $2680. However, the short-term trend remains bullish, and any price correction may be supported at these levels. The uncertainty of the US presidential election and the escalating geopolitical crisis may push up gold prices in the short term.
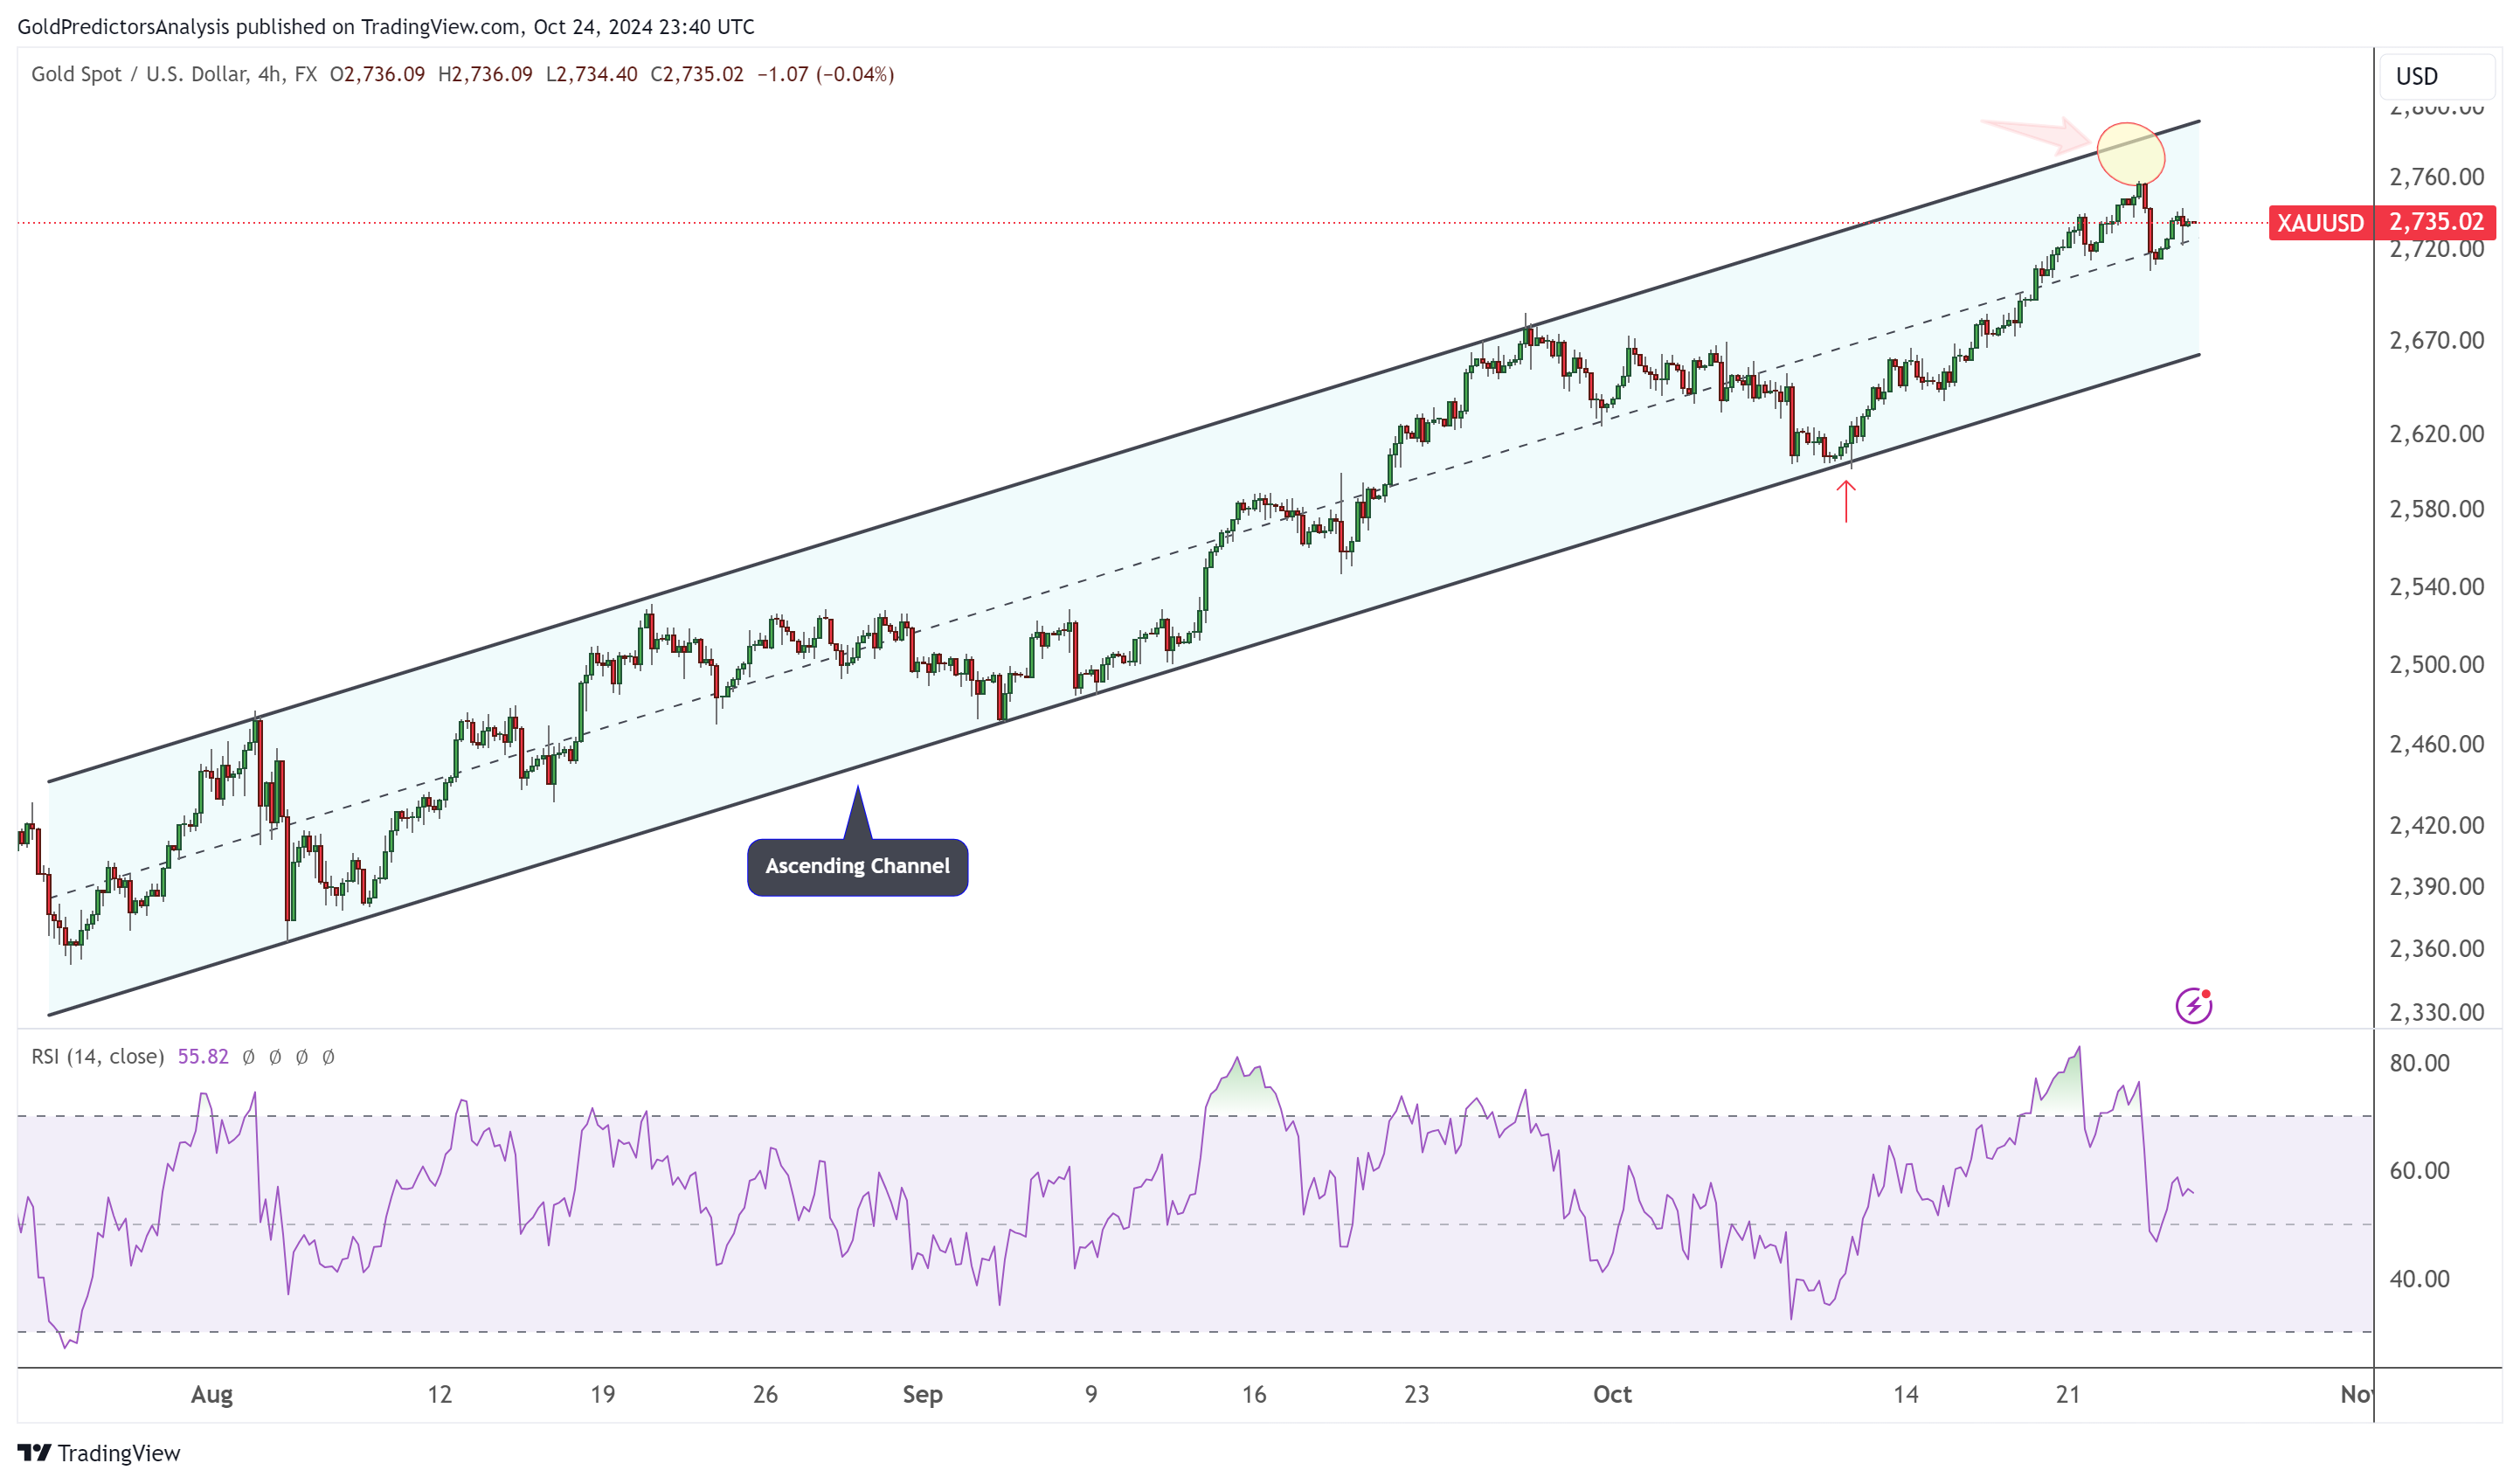
Gold 4-hour chart - consolidation in the upward trend
The 4-hour chart of gold shows that it has formed an upward channel and the price has reached the resistance zone of $2760. The upper boundary of this channel defines this resistance, indicating that prices may fluctuate around this level. However, breaking through $2760 may continue to rise to $2780.
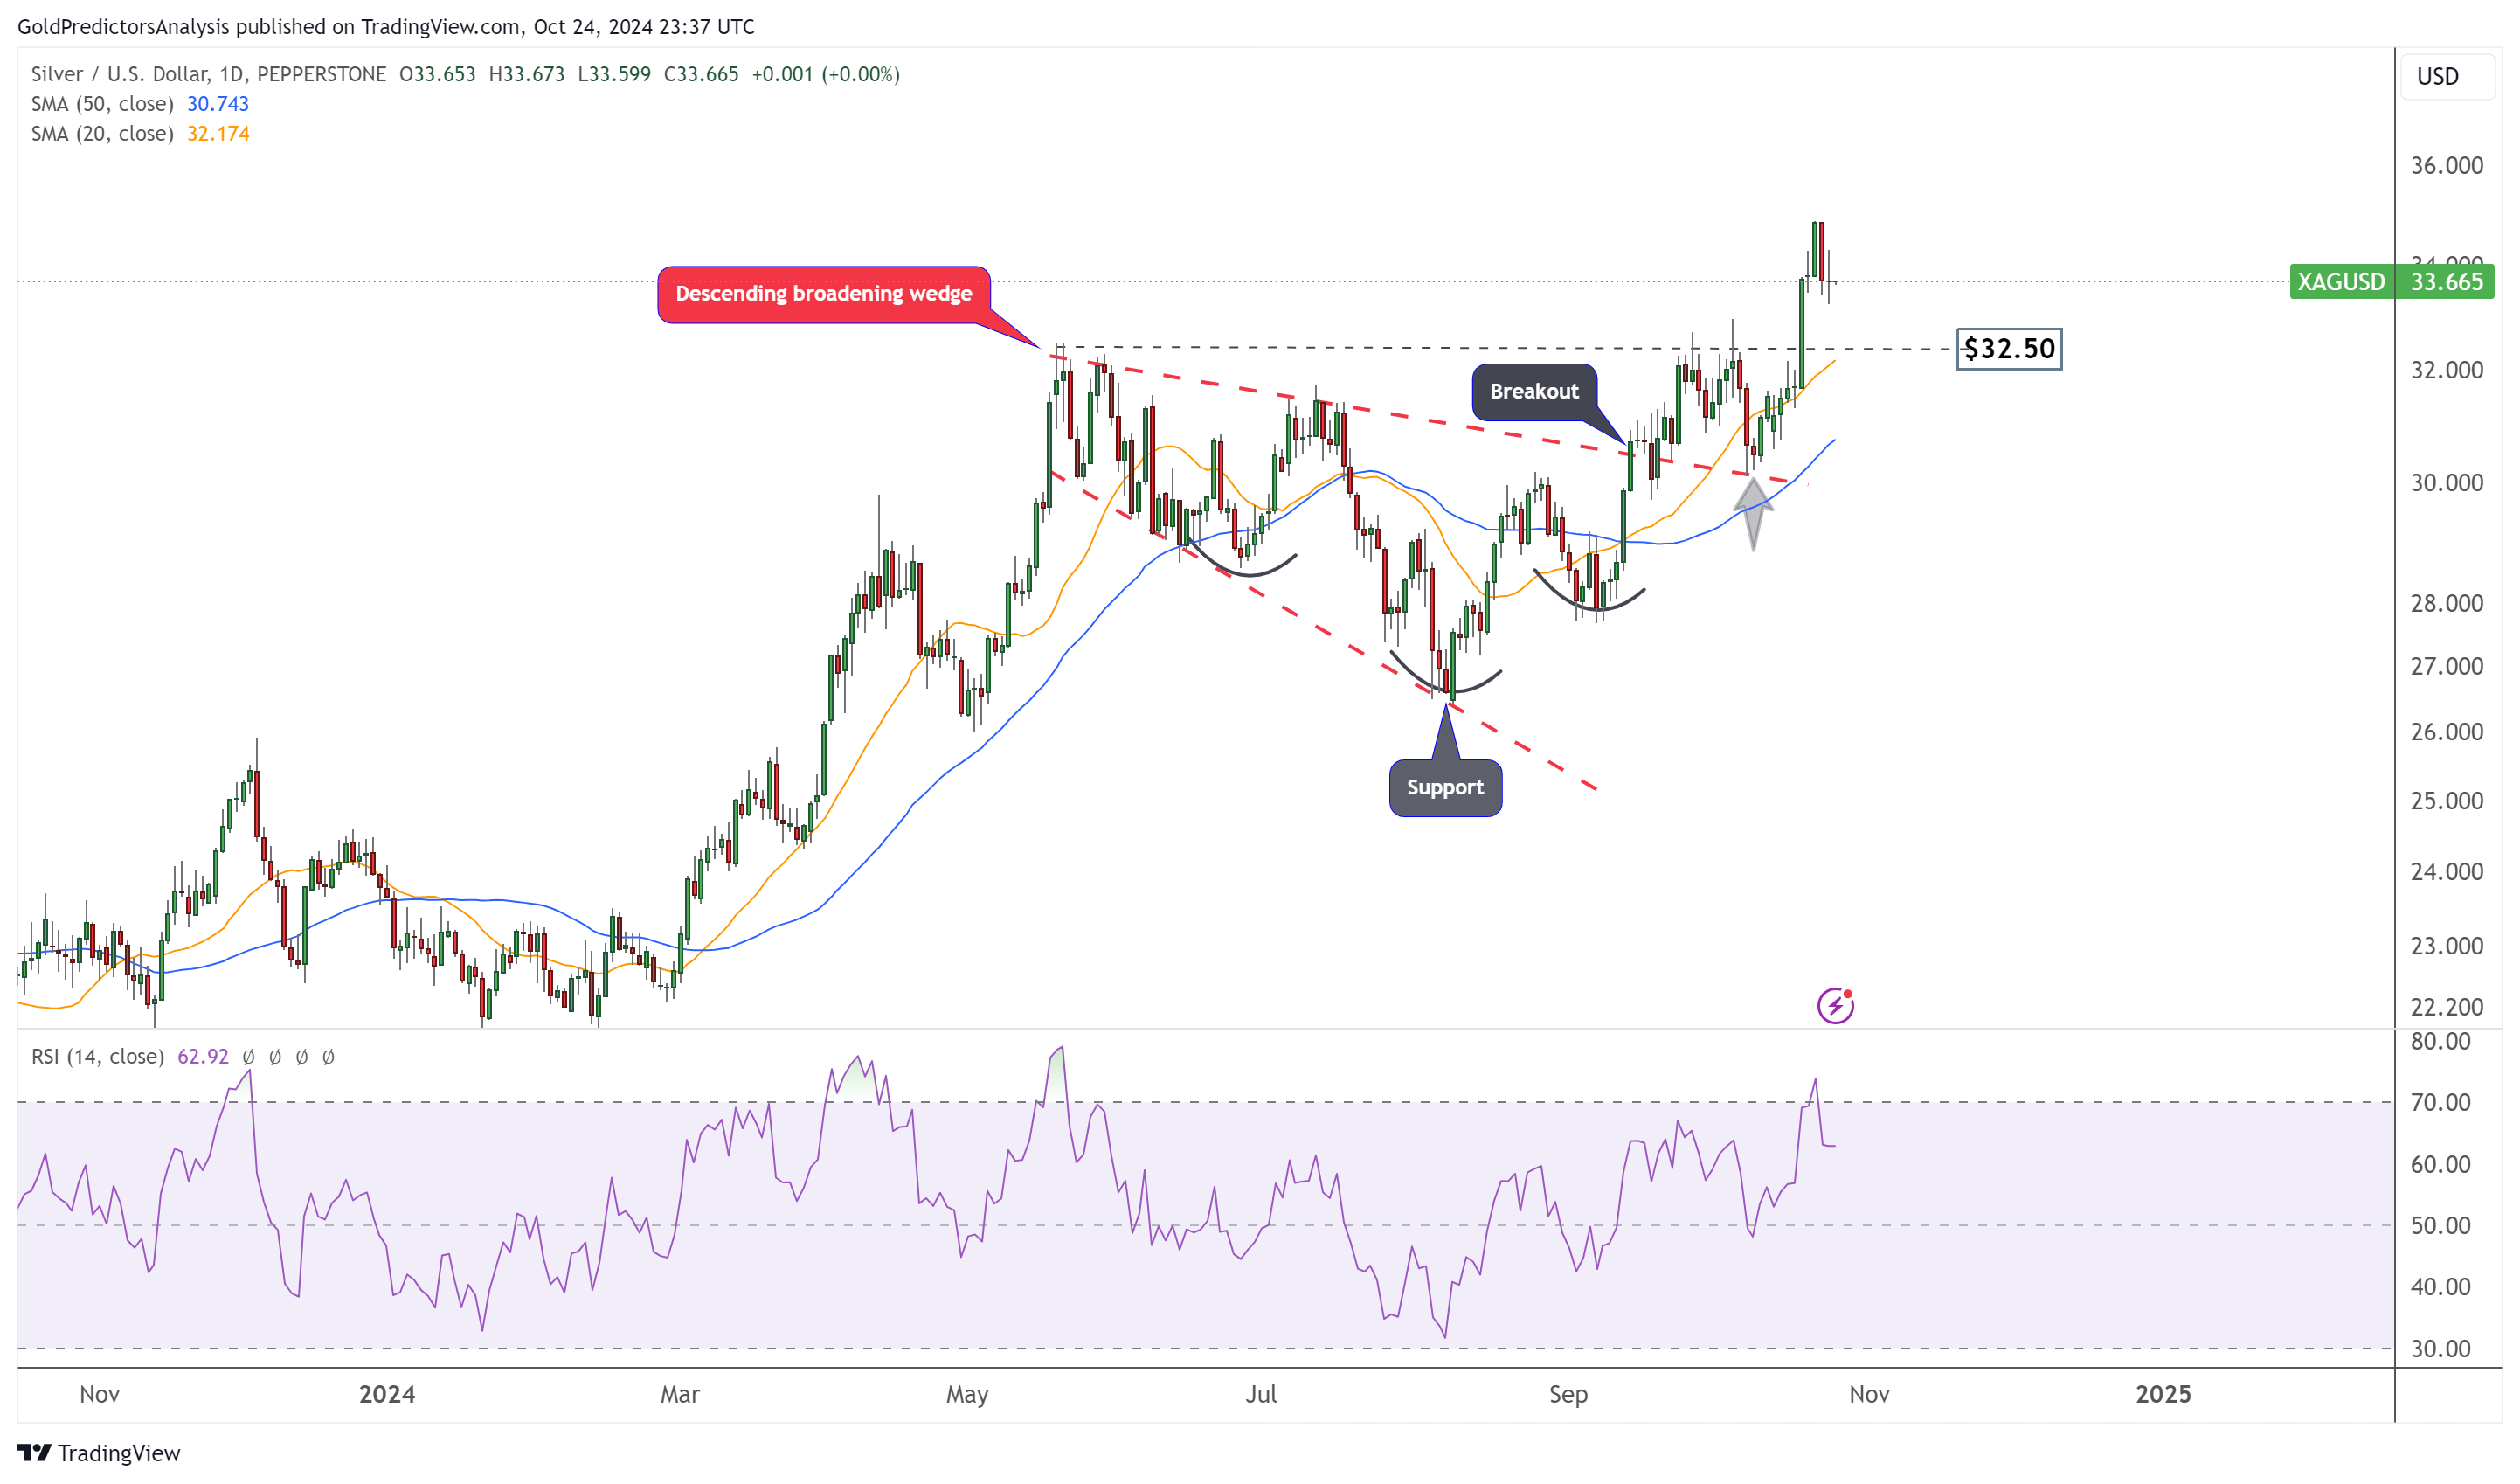
Silver Daily Chart - Downward Expansion Wedge
The daily chart shows that the price has broken through the downward expansion wedge mode and inverted head and shoulder mode at $32.50. After breaking through, the price hit the resistance level of $34.80. At present, the price is undergoing a downward correction towards the breakthrough zone of $32.50. On the 20th, SMA further strengthened this support and formed a stable support area. This correction is also driven by the overbought situation indicated by RSI.
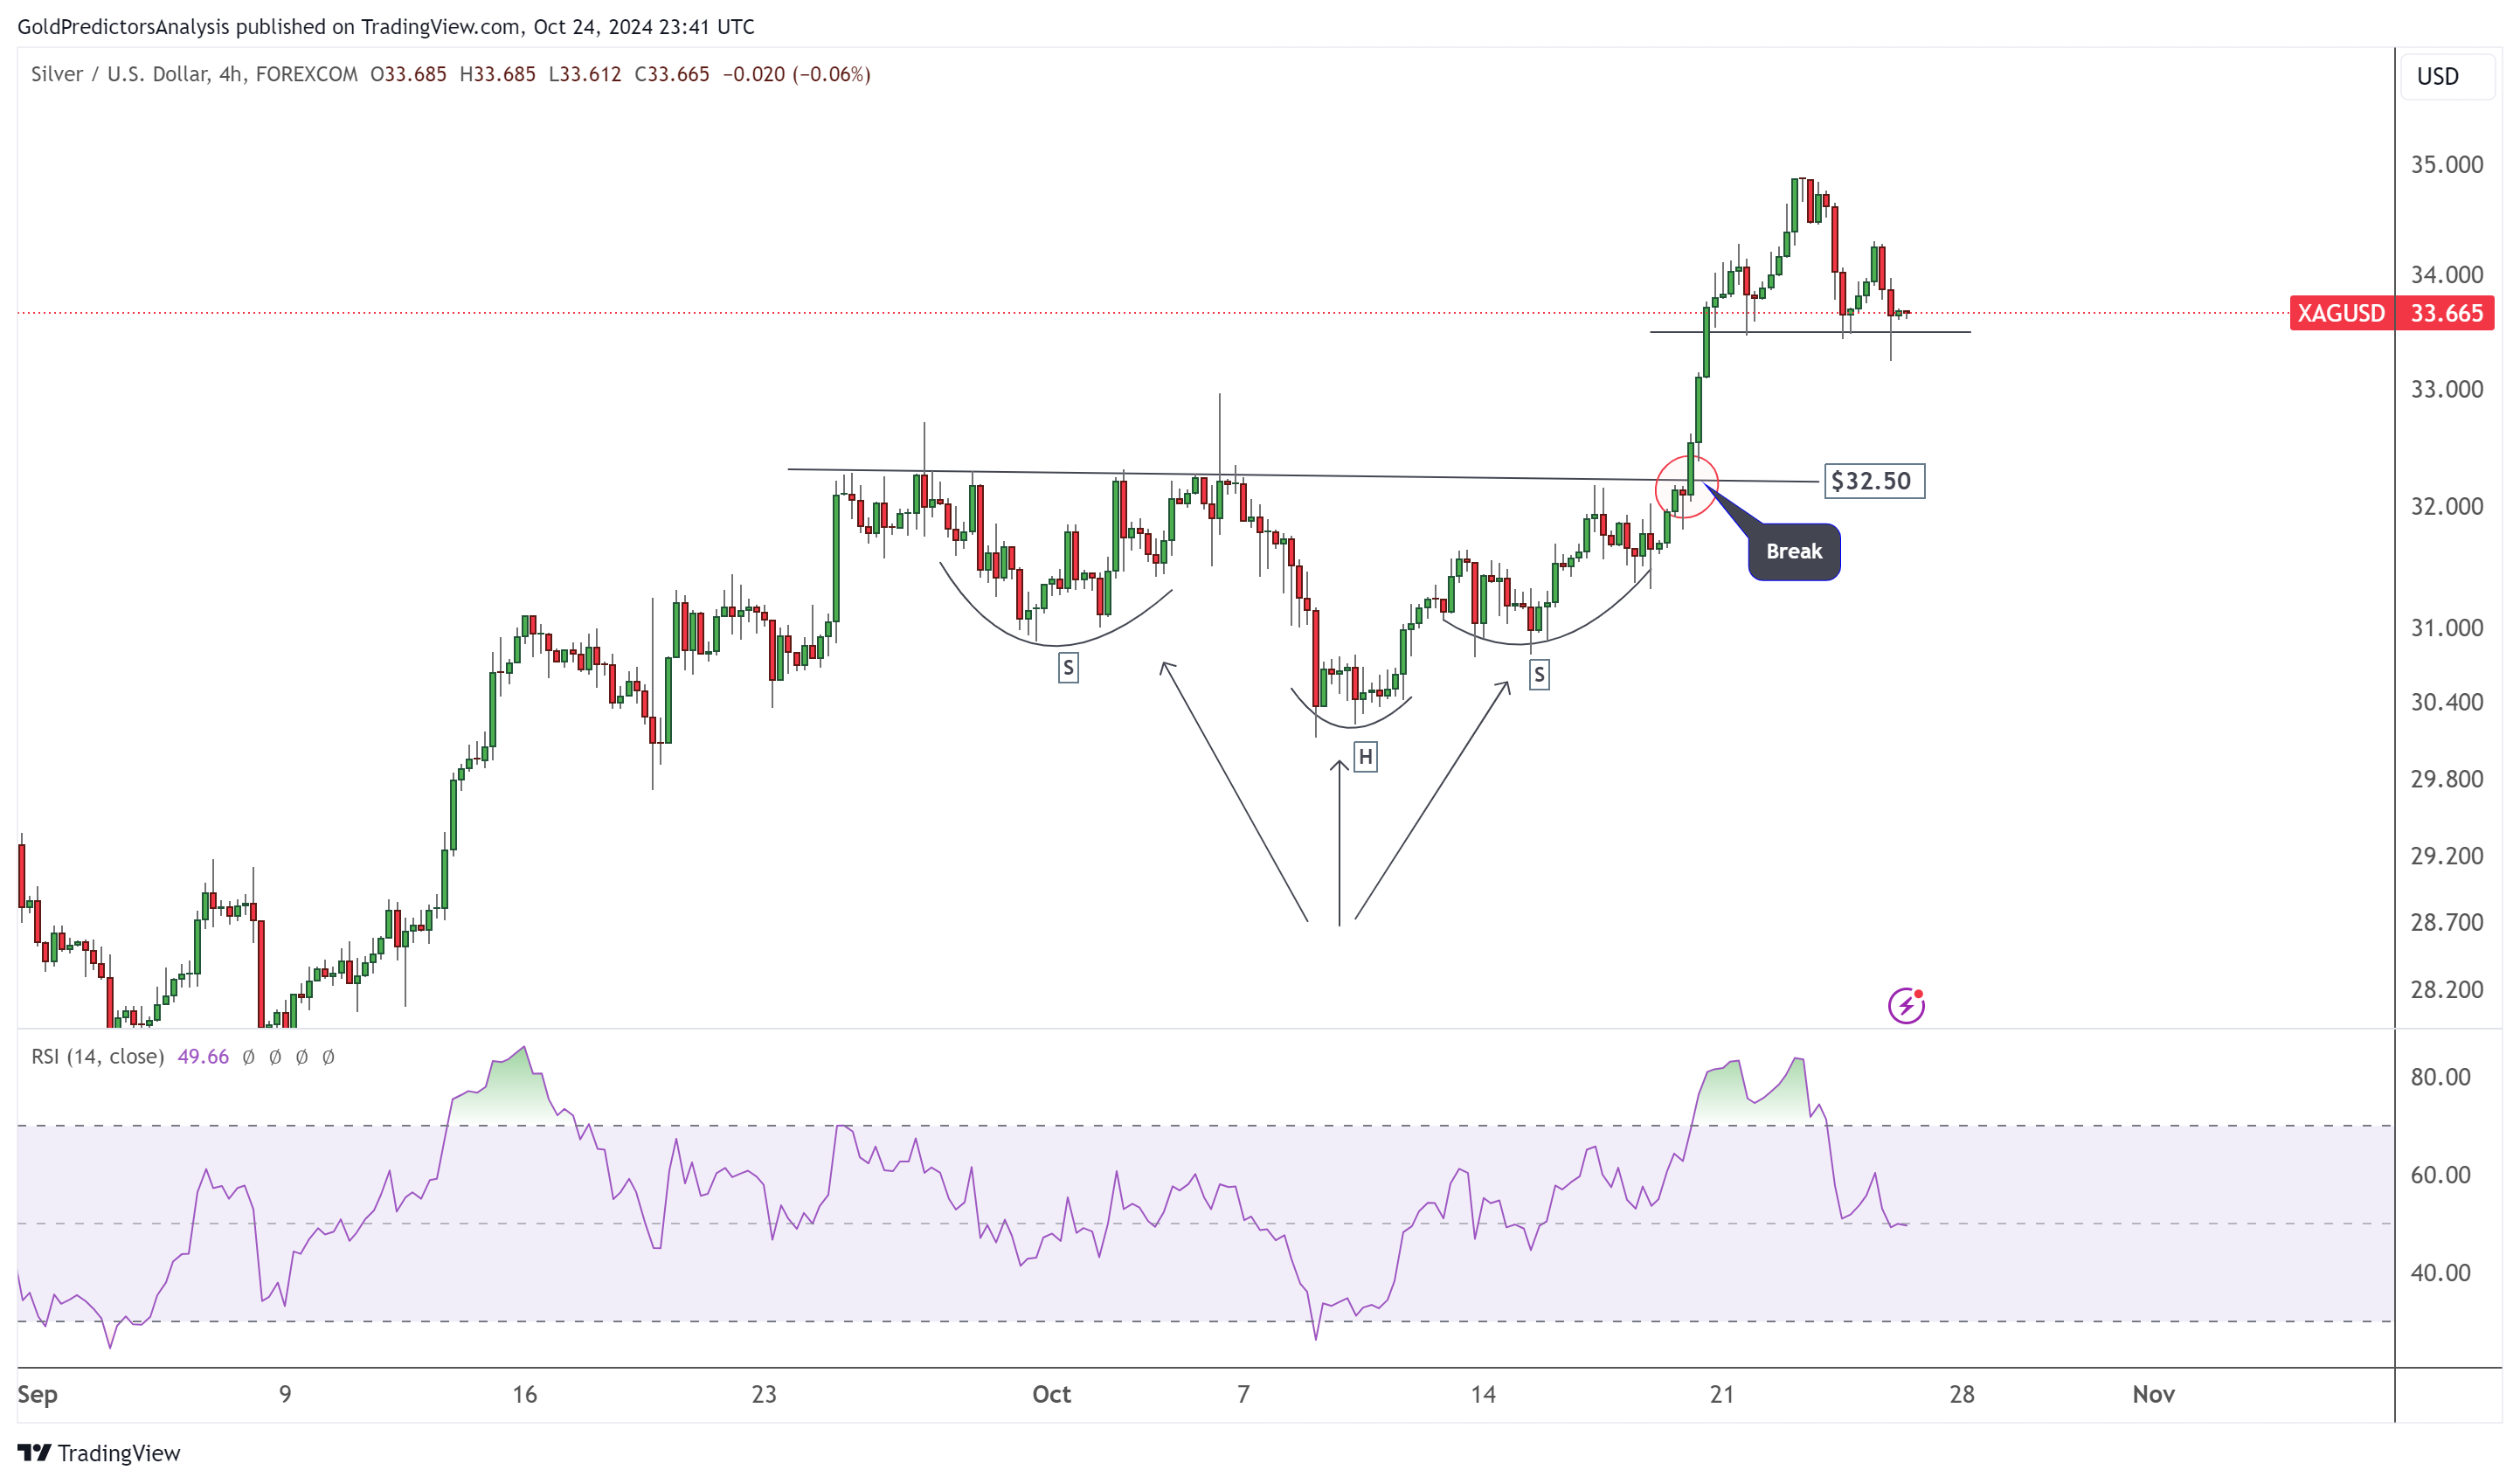
Silver 4-hour chart - Short term correction
The 4-hour chart shows that silver has broken through the upside down pattern and risen significantly. However, the RSI indicator shows that silver prices are in an extremely overbought state and are currently undergoing a downward correction towards the breakout zone. Despite the correction, the short-term trend of silver remains bullish, with $32.50 being a strong support level.
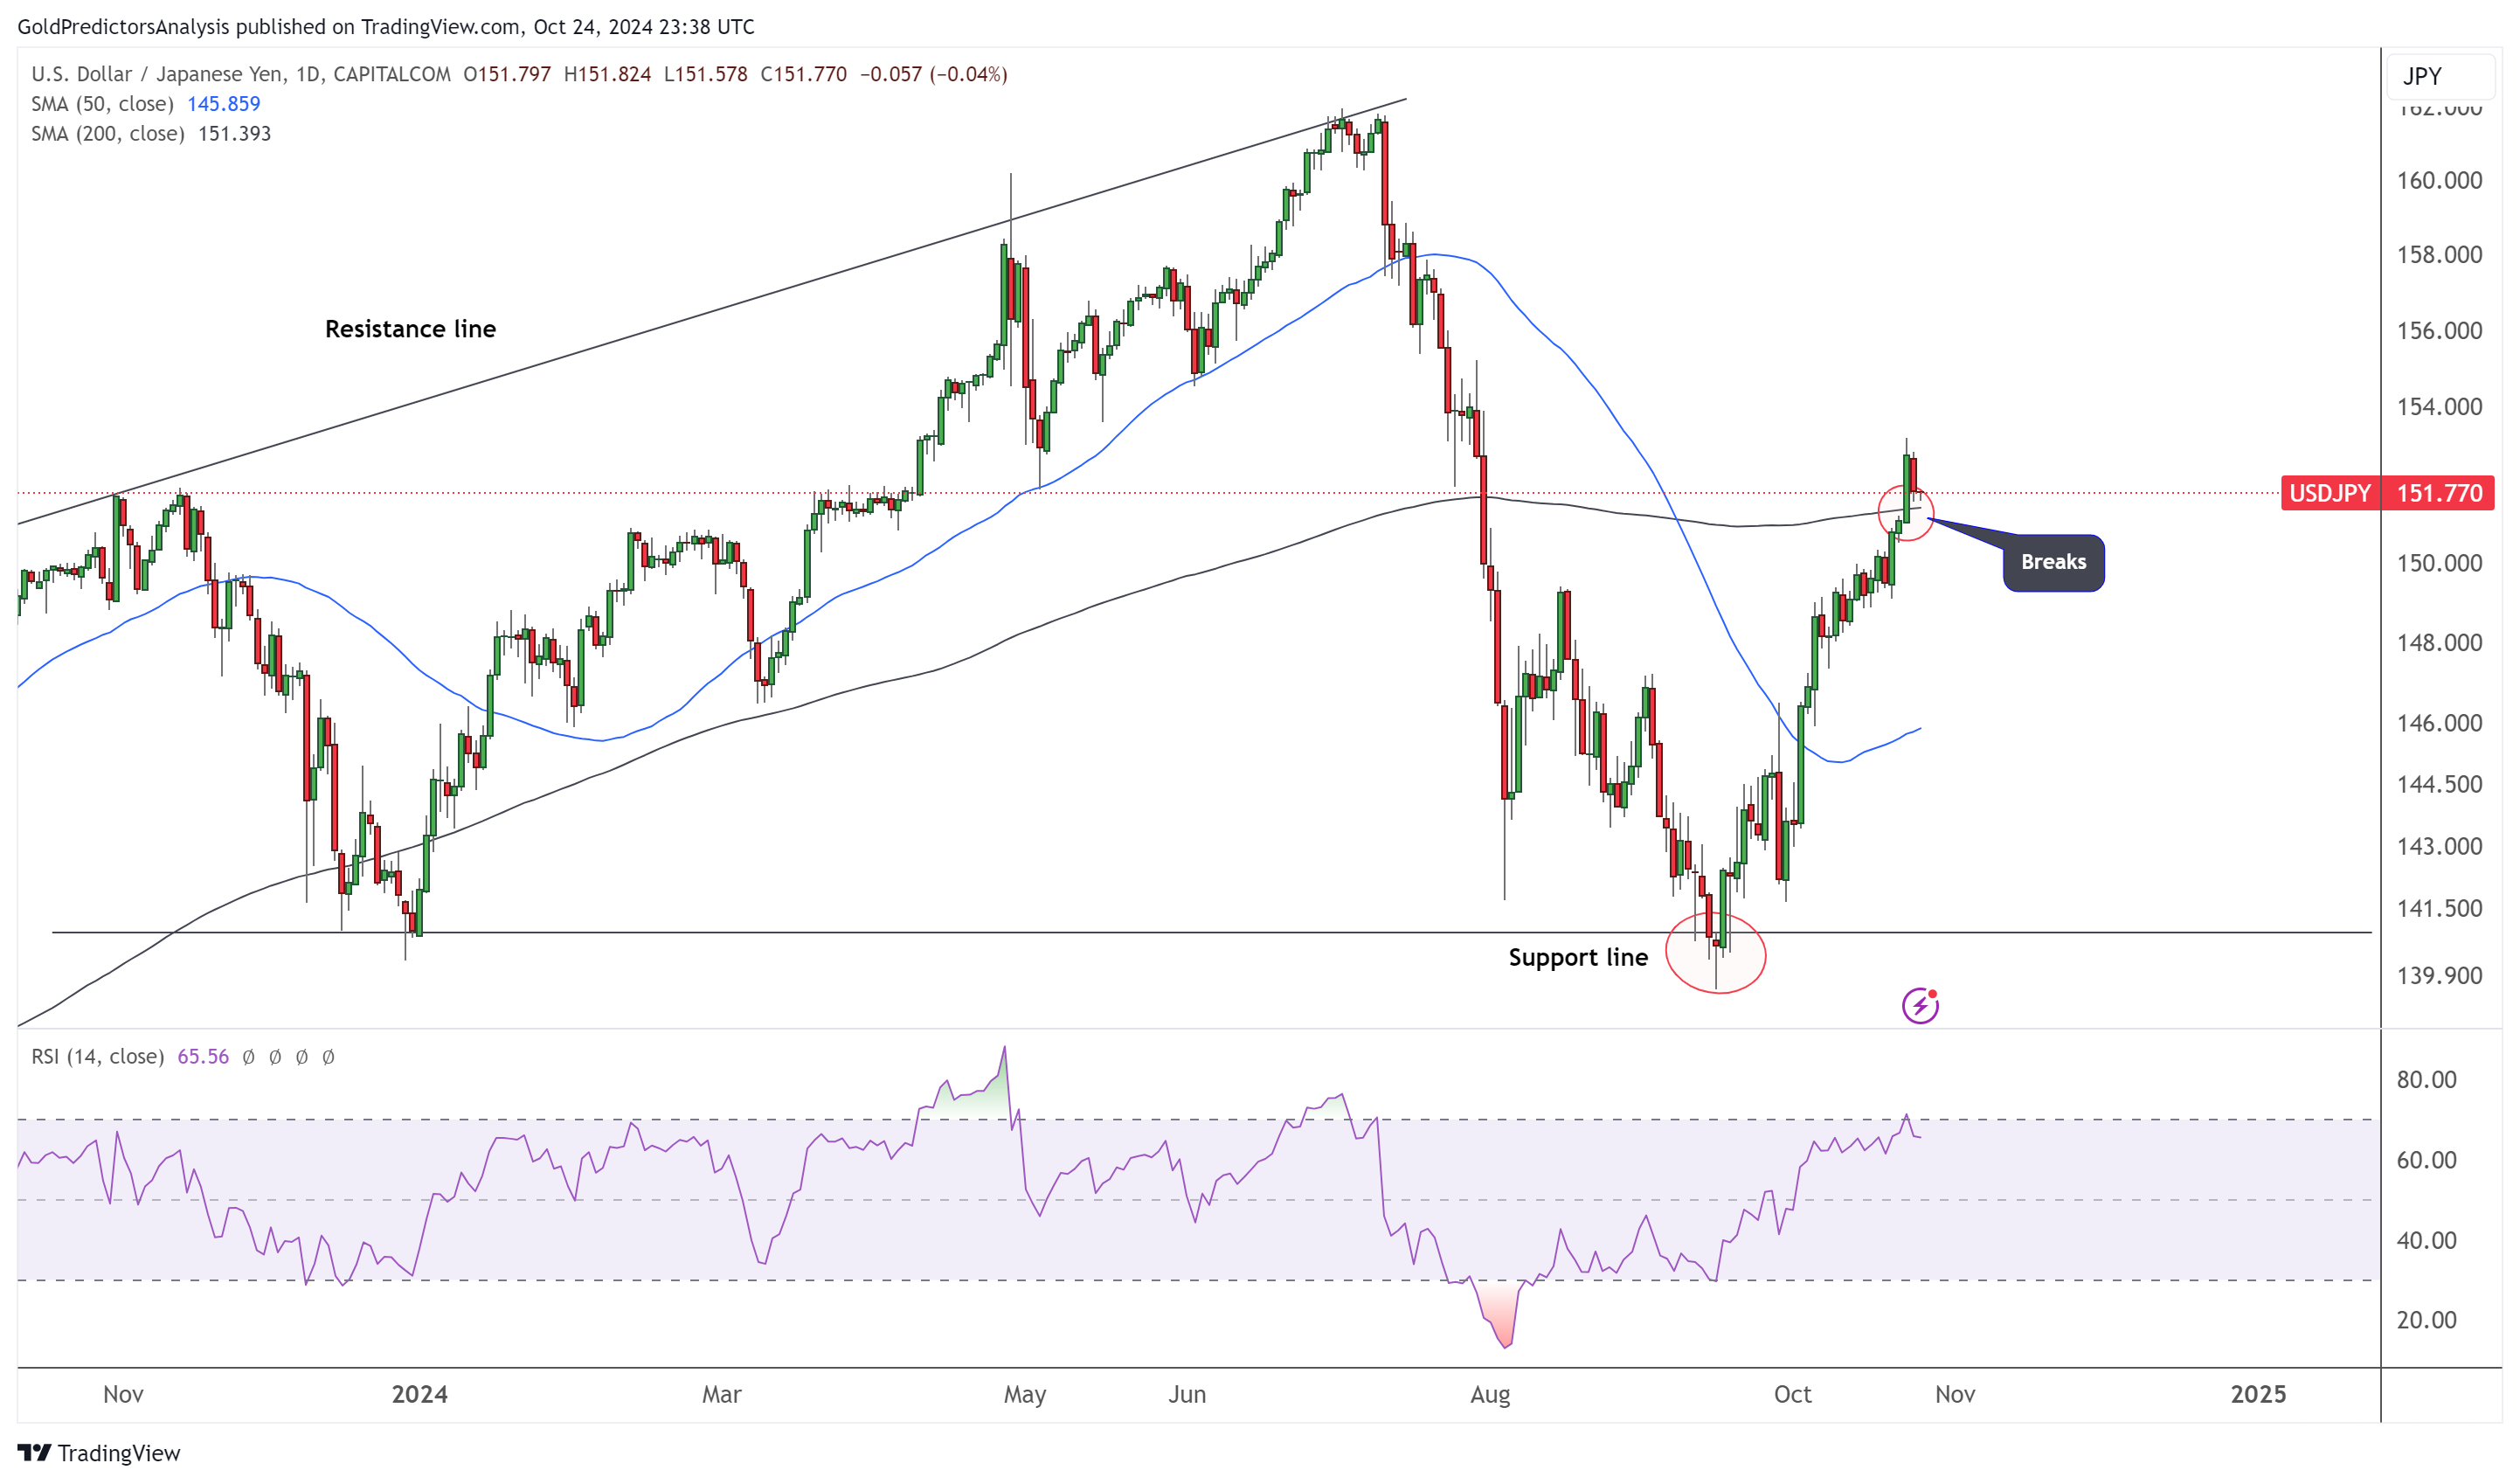
USD/JPY daily chart - Breaking through 200 SMA
The daily chart of USD/JPY shows a strong rebound of the currency pair from the long-term support level of $140-141. The price continues to rise after this support level. The price closed above 200 SMA, indicating a positive price trend. In addition, the 50 SMA shows an upward trend, indicating a strengthening price. However, RSI shows that the currency pair is in the short-term overbought zone, indicating a possible price correction.
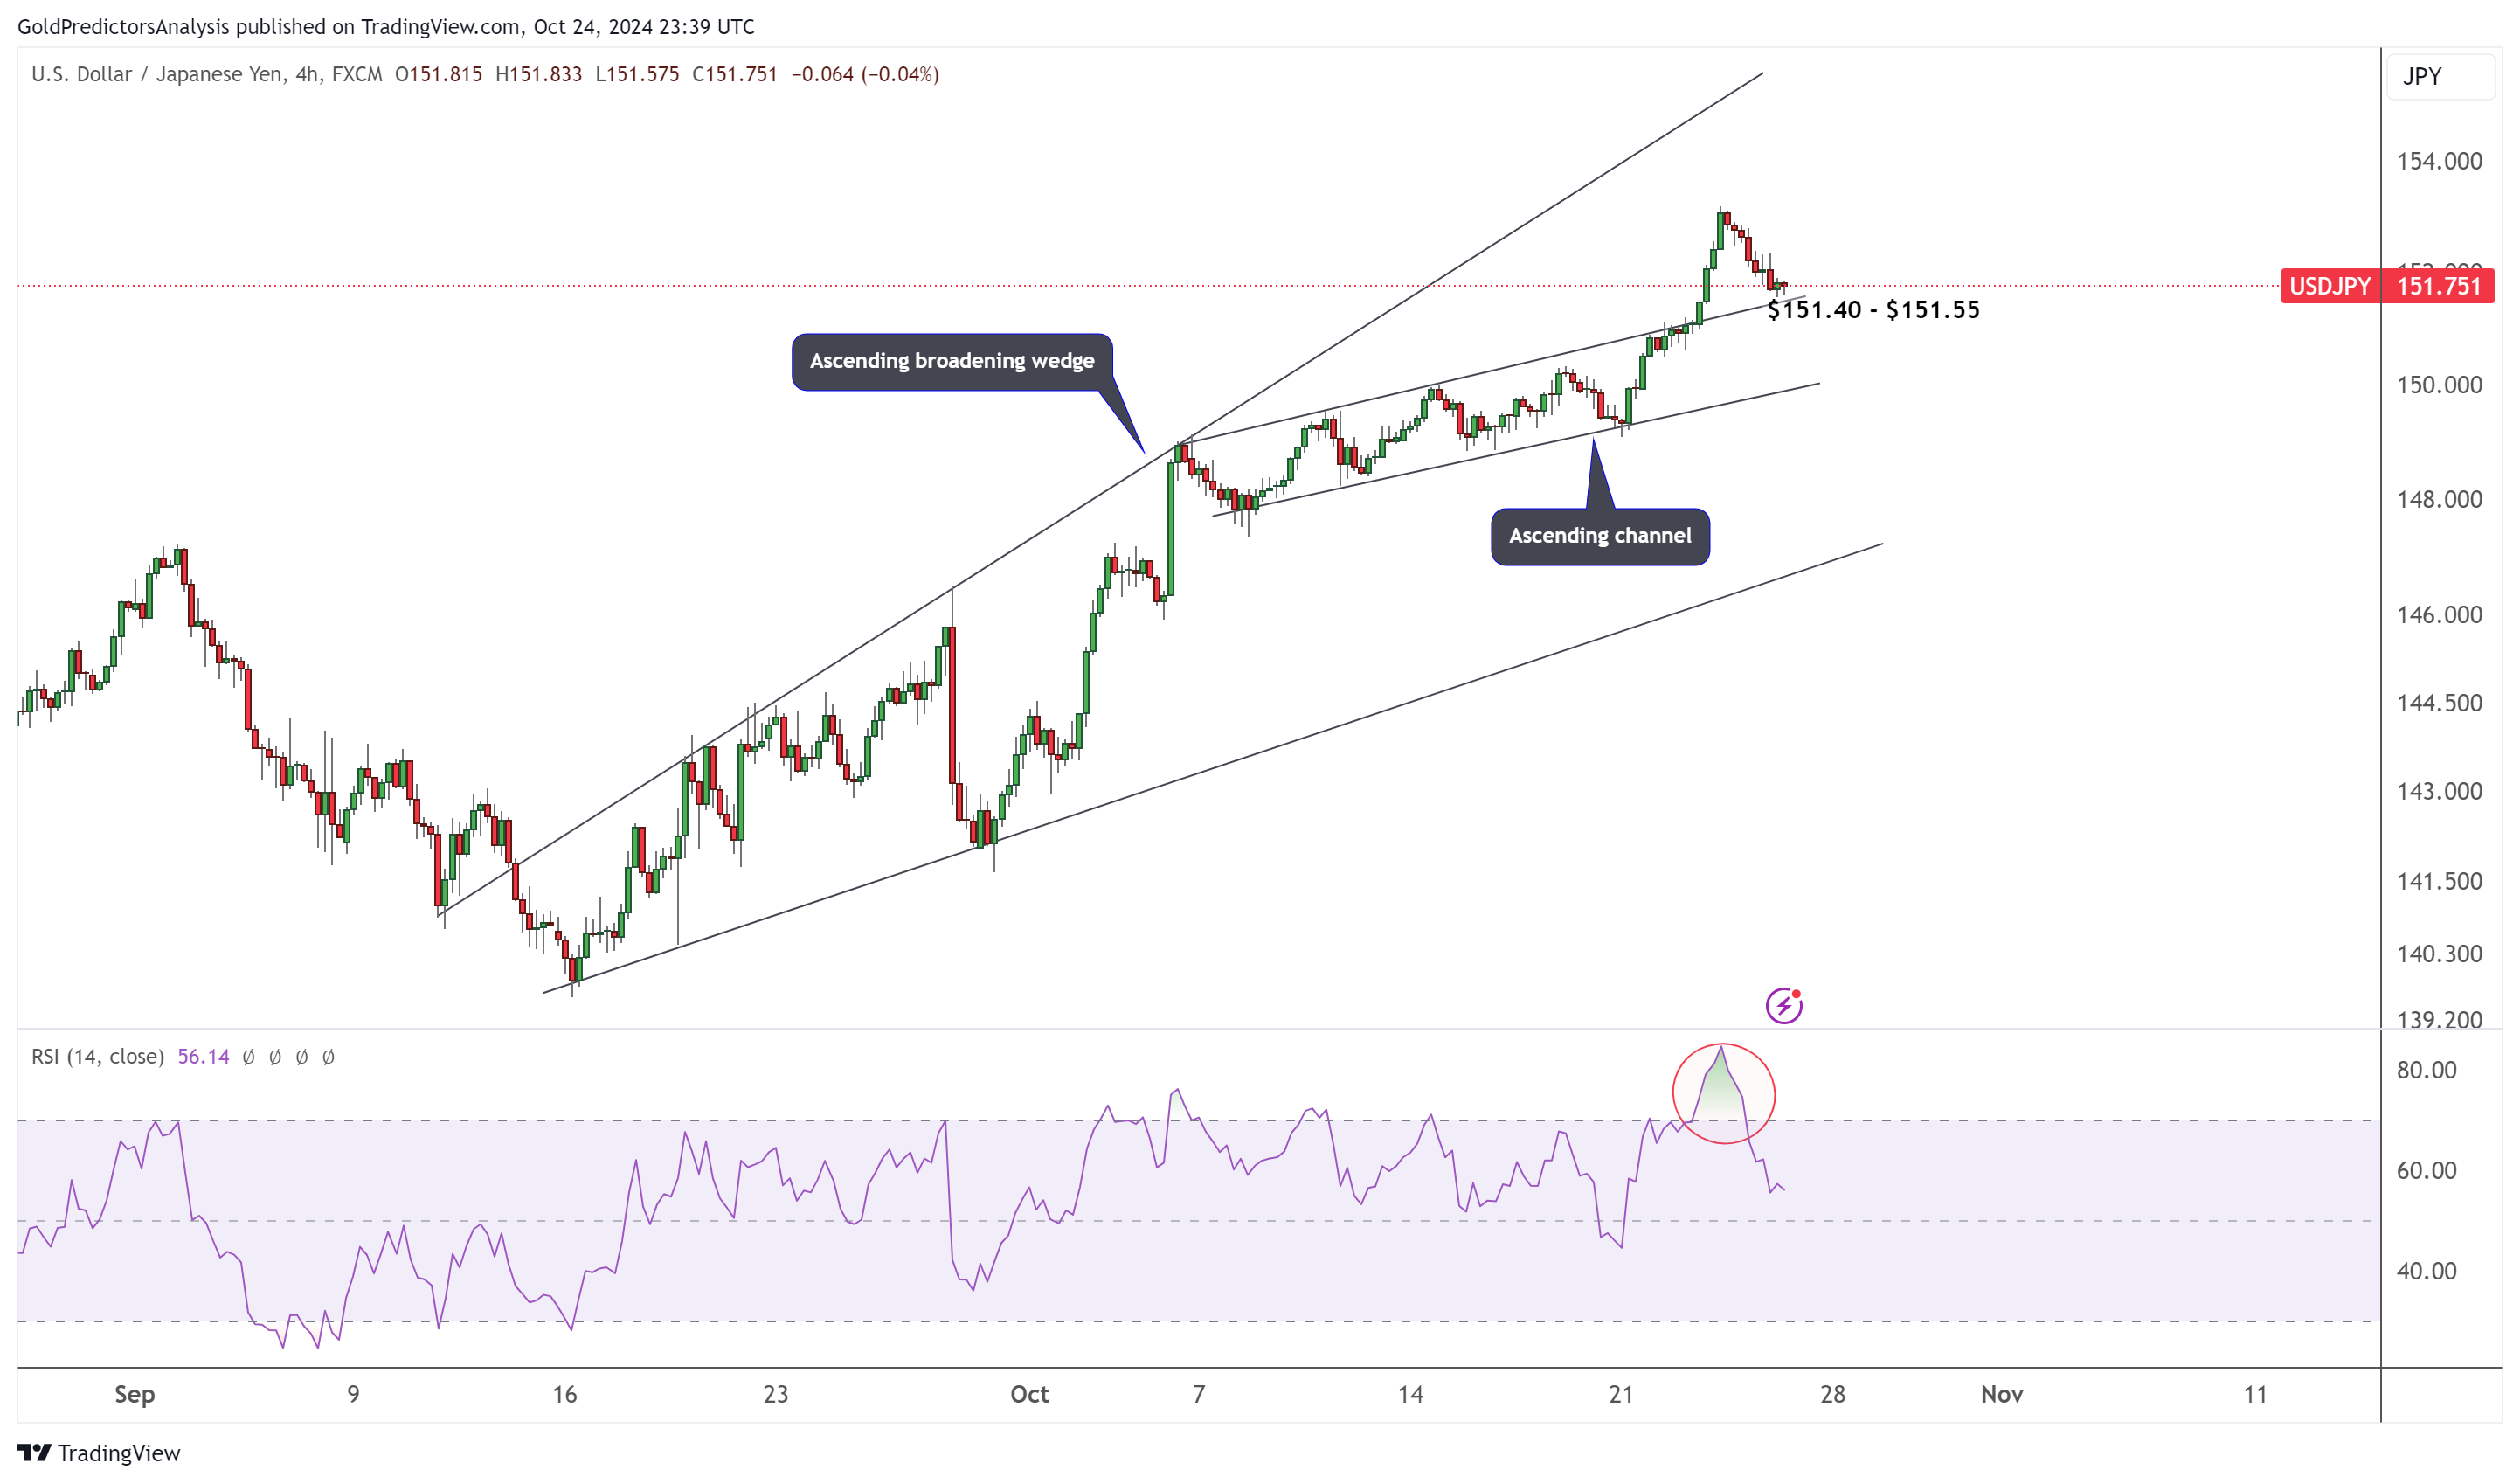
USD/JPY 4-hour chart - Upward expansion wedge
The 4-hour chart shows that the US dollar/Japanese yen rebounded from the long-term support level of $140, forming an upward expanding wedge shape. Over the past month, prices have been fluctuating within this pattern. An upward channel has also formed within the form, indicating strong support levels of $151.40 and $151.55. Due to the recent adjustment caused by the highly overbought situation on the 4-hour chart, prices may continue to fluctuate due to the uncertainty of the US election.
Tips:This page came from Internet, which is not standing for FXCUE opinions of this website.
Statement:Contact us if the content violates the law or your rights
