The short-term outlook for gold prices has turned bullish, with a focus on resistance from June's high point
On Thursday (July 4th) during Asian trading, the US dollar index continued to be under pressure and is currently around 105.30; Spot gold fluctuated at a high level after a sharp rise yesterday, and is currently trading around $2359.68 per ounce. Valeria Bednarik, Chief Analyst of FXTree, wrote an article analyzing the prospects of gold technology.
Bednarik pointed out that due to selling pressure on the US dollar, gold prices have broken through the $2360/ounce mark for the first time in over two weeks. The short-term outlook for gold has turned bullish and may break through the June high of $2368.59 per ounce.
On Wednesday, recent US data showed that the labor market was weakening, with increased bets on the Fed's September rate cut, and gold prices rising by over 1%.
Spot gold closed up $26.88, or 1.2%, at $2356.02 per ounce on Wednesday. The highest gold price touched $2364.96 per ounce during trading.
As of the week ending June 29th, the adjusted number of initial jobless claims in the United States was 238000, higher than market expectations of 234000. As of the week ending June 22, the adjusted number of Americans reapplying for unemployment benefits was 1.858 million, higher than market expectations and reaching a new high since November 2021.
The ADP employment report, known as the "small non farm" sector, showed that the number of people employed by private enterprises increased by 150000 in June, marking the third consecutive month of decline and reaching a new low since January this year, lower than economists' expectations of 163000 people.
The market focus has shifted to Friday's non farm payroll report, which is expected to add 190000 job opportunities in June.
The US dollar index, which tracks the US dollar against six major currencies, closed down 0.33% on Wednesday at 105.35, dropping sharply to a three week low of 105.05 during trading.
Analysis of Short term Technical Prospects for Gold
Bednarik stated that from a technical perspective, the gold daily chart shows that gold prices have encountered buyers near the 20 day simple moving average (SMA), which is currently around $2330 per ounce; However, the 100 day SMA and 200 day SMA continued to rise at levels much lower than the 20 day SMA. At the same time, technical indicators have rebounded at a positive level, consistent with the view that gold prices will experience another wave of upward momentum. The resistance level is at $2368.59 per ounce, which is the highest level in June.
Bednarik added that in the short term, according to the 4-hour chart, the risk of gold price trends also tends to be upward. The price of gold is currently above all of its moving averages, and the 20 cycle SMA is rising between longer moving lines without direction. At the same time, the technical indicators are close to overbought readings and there are no signs of weak upward momentum.
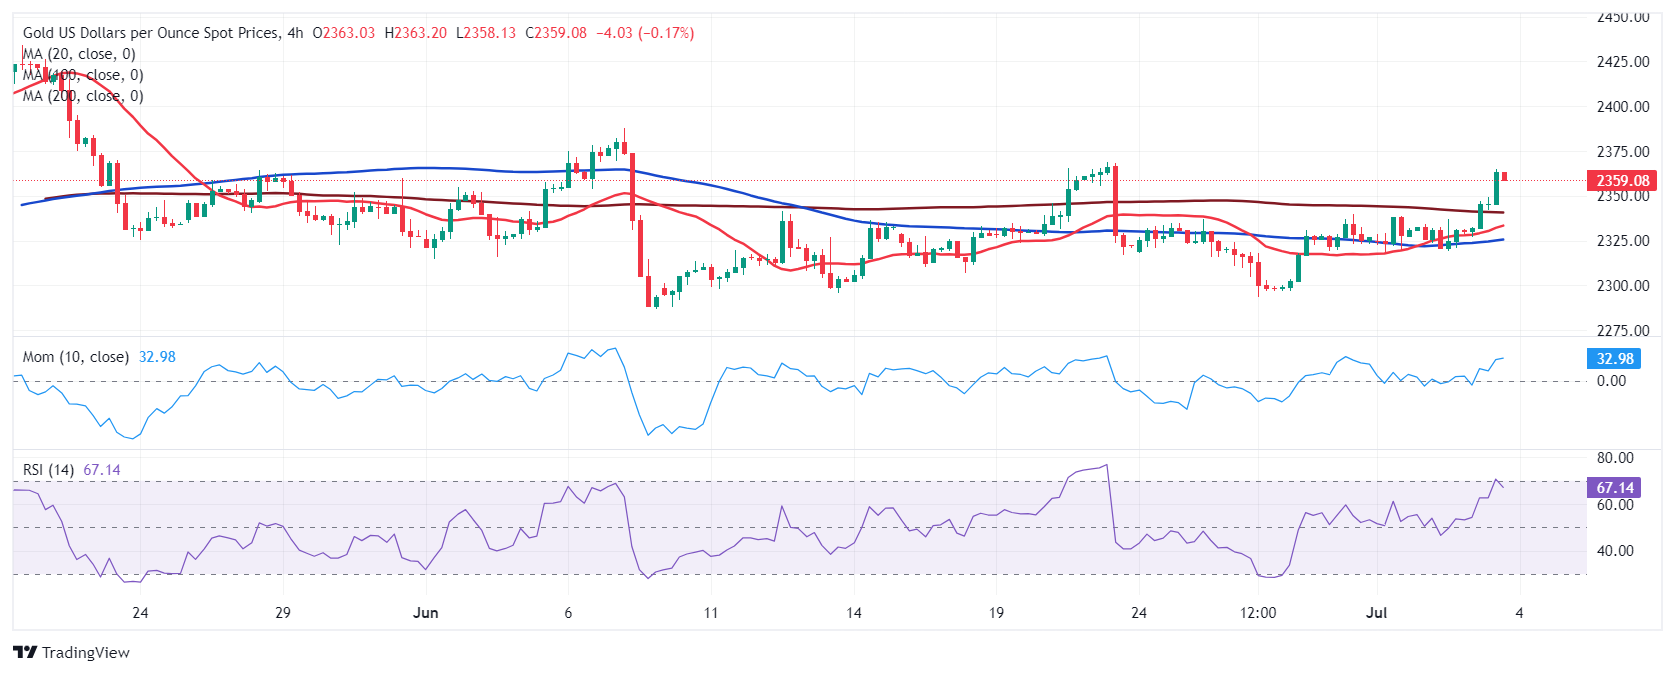
Bednarik provides the latest important support and resistance levels for gold prices:
Support level: 2341.50 USD/oz; $2329.20 per ounce; 2313.60 USD/oz
Resistance level: $2368.60/ounce; 2387.60 USD/oz; $2400.00 per ounce
Tips:This page came from Internet, which is not standing for FXCUE opinions of this website.
Statement:Contact us if the content violates the law or your rights