Gold forecast above 2400 pressure, pay attention to new developments in the Federal Reserve's expected interest rate cut this week
Last week (0701-0705), gold surged 2.78% to close at $2390.85 per ounce. After being hit again by the purple bold resistance line we are concerned about on July 1st (see 4H chart below), the price of gold was resilient like a small strong, quickly receiving buying support every time it touched $2318, and then opened up two waves of upward momentum. The second wave of momentum was directly driven by the non-agricultural market - the "fake strength" of non-agricultural markets made gold bulls like spring breeze, soaring from $2348 to $2392.82 per ounce.
From the daily and weekly charts, it can be seen that the gold price is almost a bearish bullish candlestick. In the non farm rally, the gold price directly overcame two previous highs: $2368.62 and $2387.59 per ounce. Moreover, from a small perspective, it can be seen that the gold price has already retraced above $2388 before the closing, but still closed above it, indicating sufficient bullish confidence.
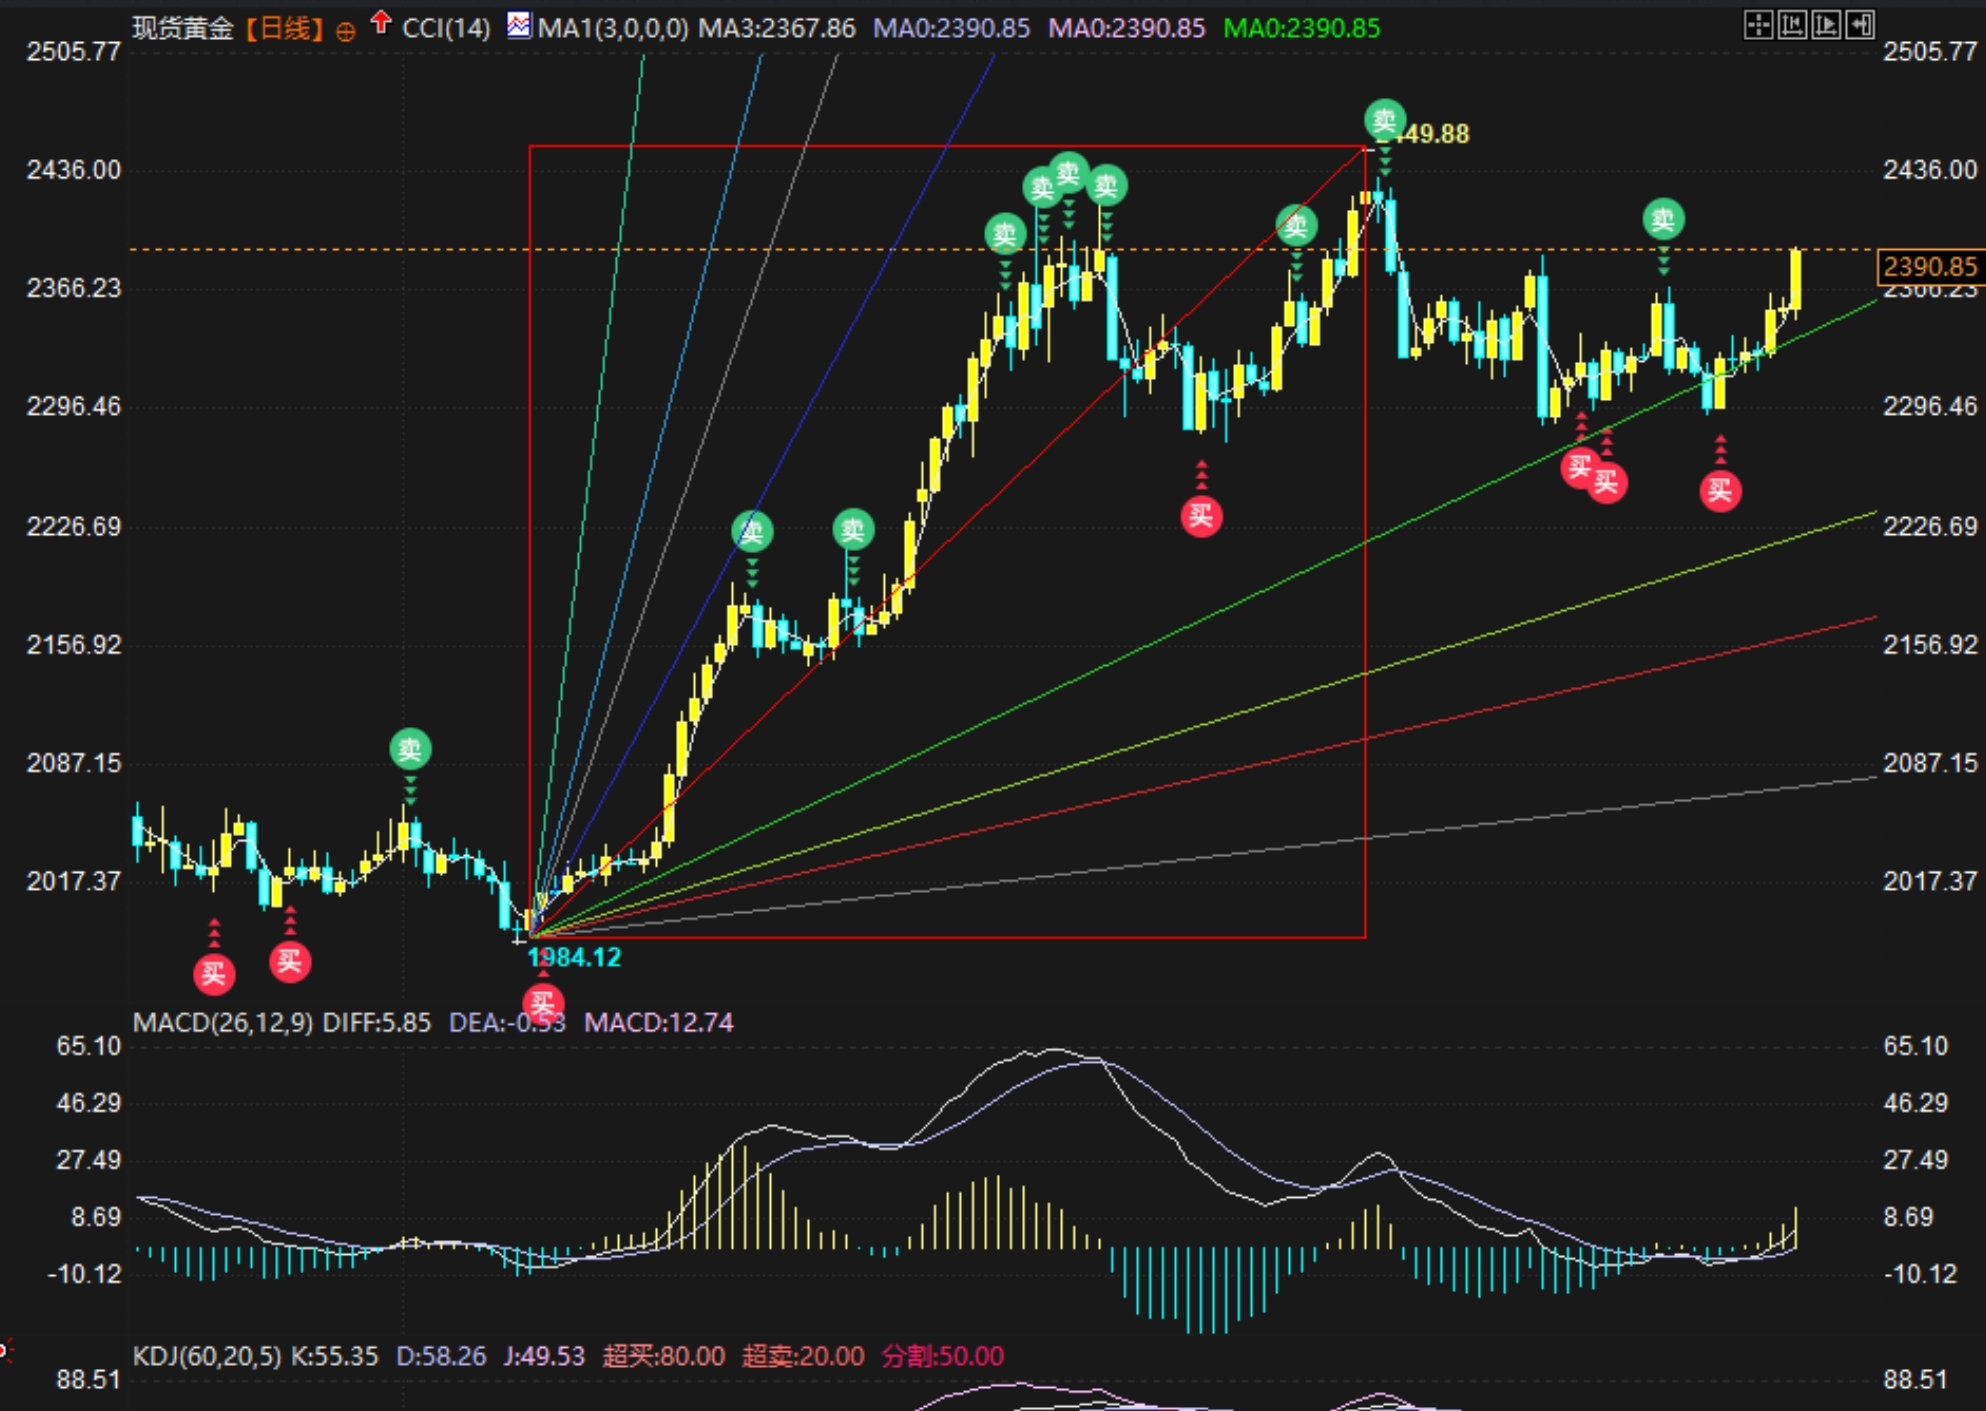
Technical analysis of spot gold daily chart
As shown in the figure below, spot gold remained within the purple upward channel for 4 hours. After the sharp rise last Friday, the gold price has reached the upper track of the purple channel and near the upper track of the red channel. Due to the fierce upward trend, it may continue to rise this week, but attention should be paid to the degree of digestion of the upward momentum. The technical indicators corresponding to this market trend have seen overbought, but there is no sign of deviation. There is a possibility of breaking through the purple and red upper tracks, but it is expected to undergo a step back confirmation after breaking through. Other resistance may need to look at the horizontal pressure level, the 2400 mark, and then the four yellow resistance lines shown in the figure. Preliminary resistance focuses on 2406, 2315 (horizontal and 100% expansion), 2426, and 2433.
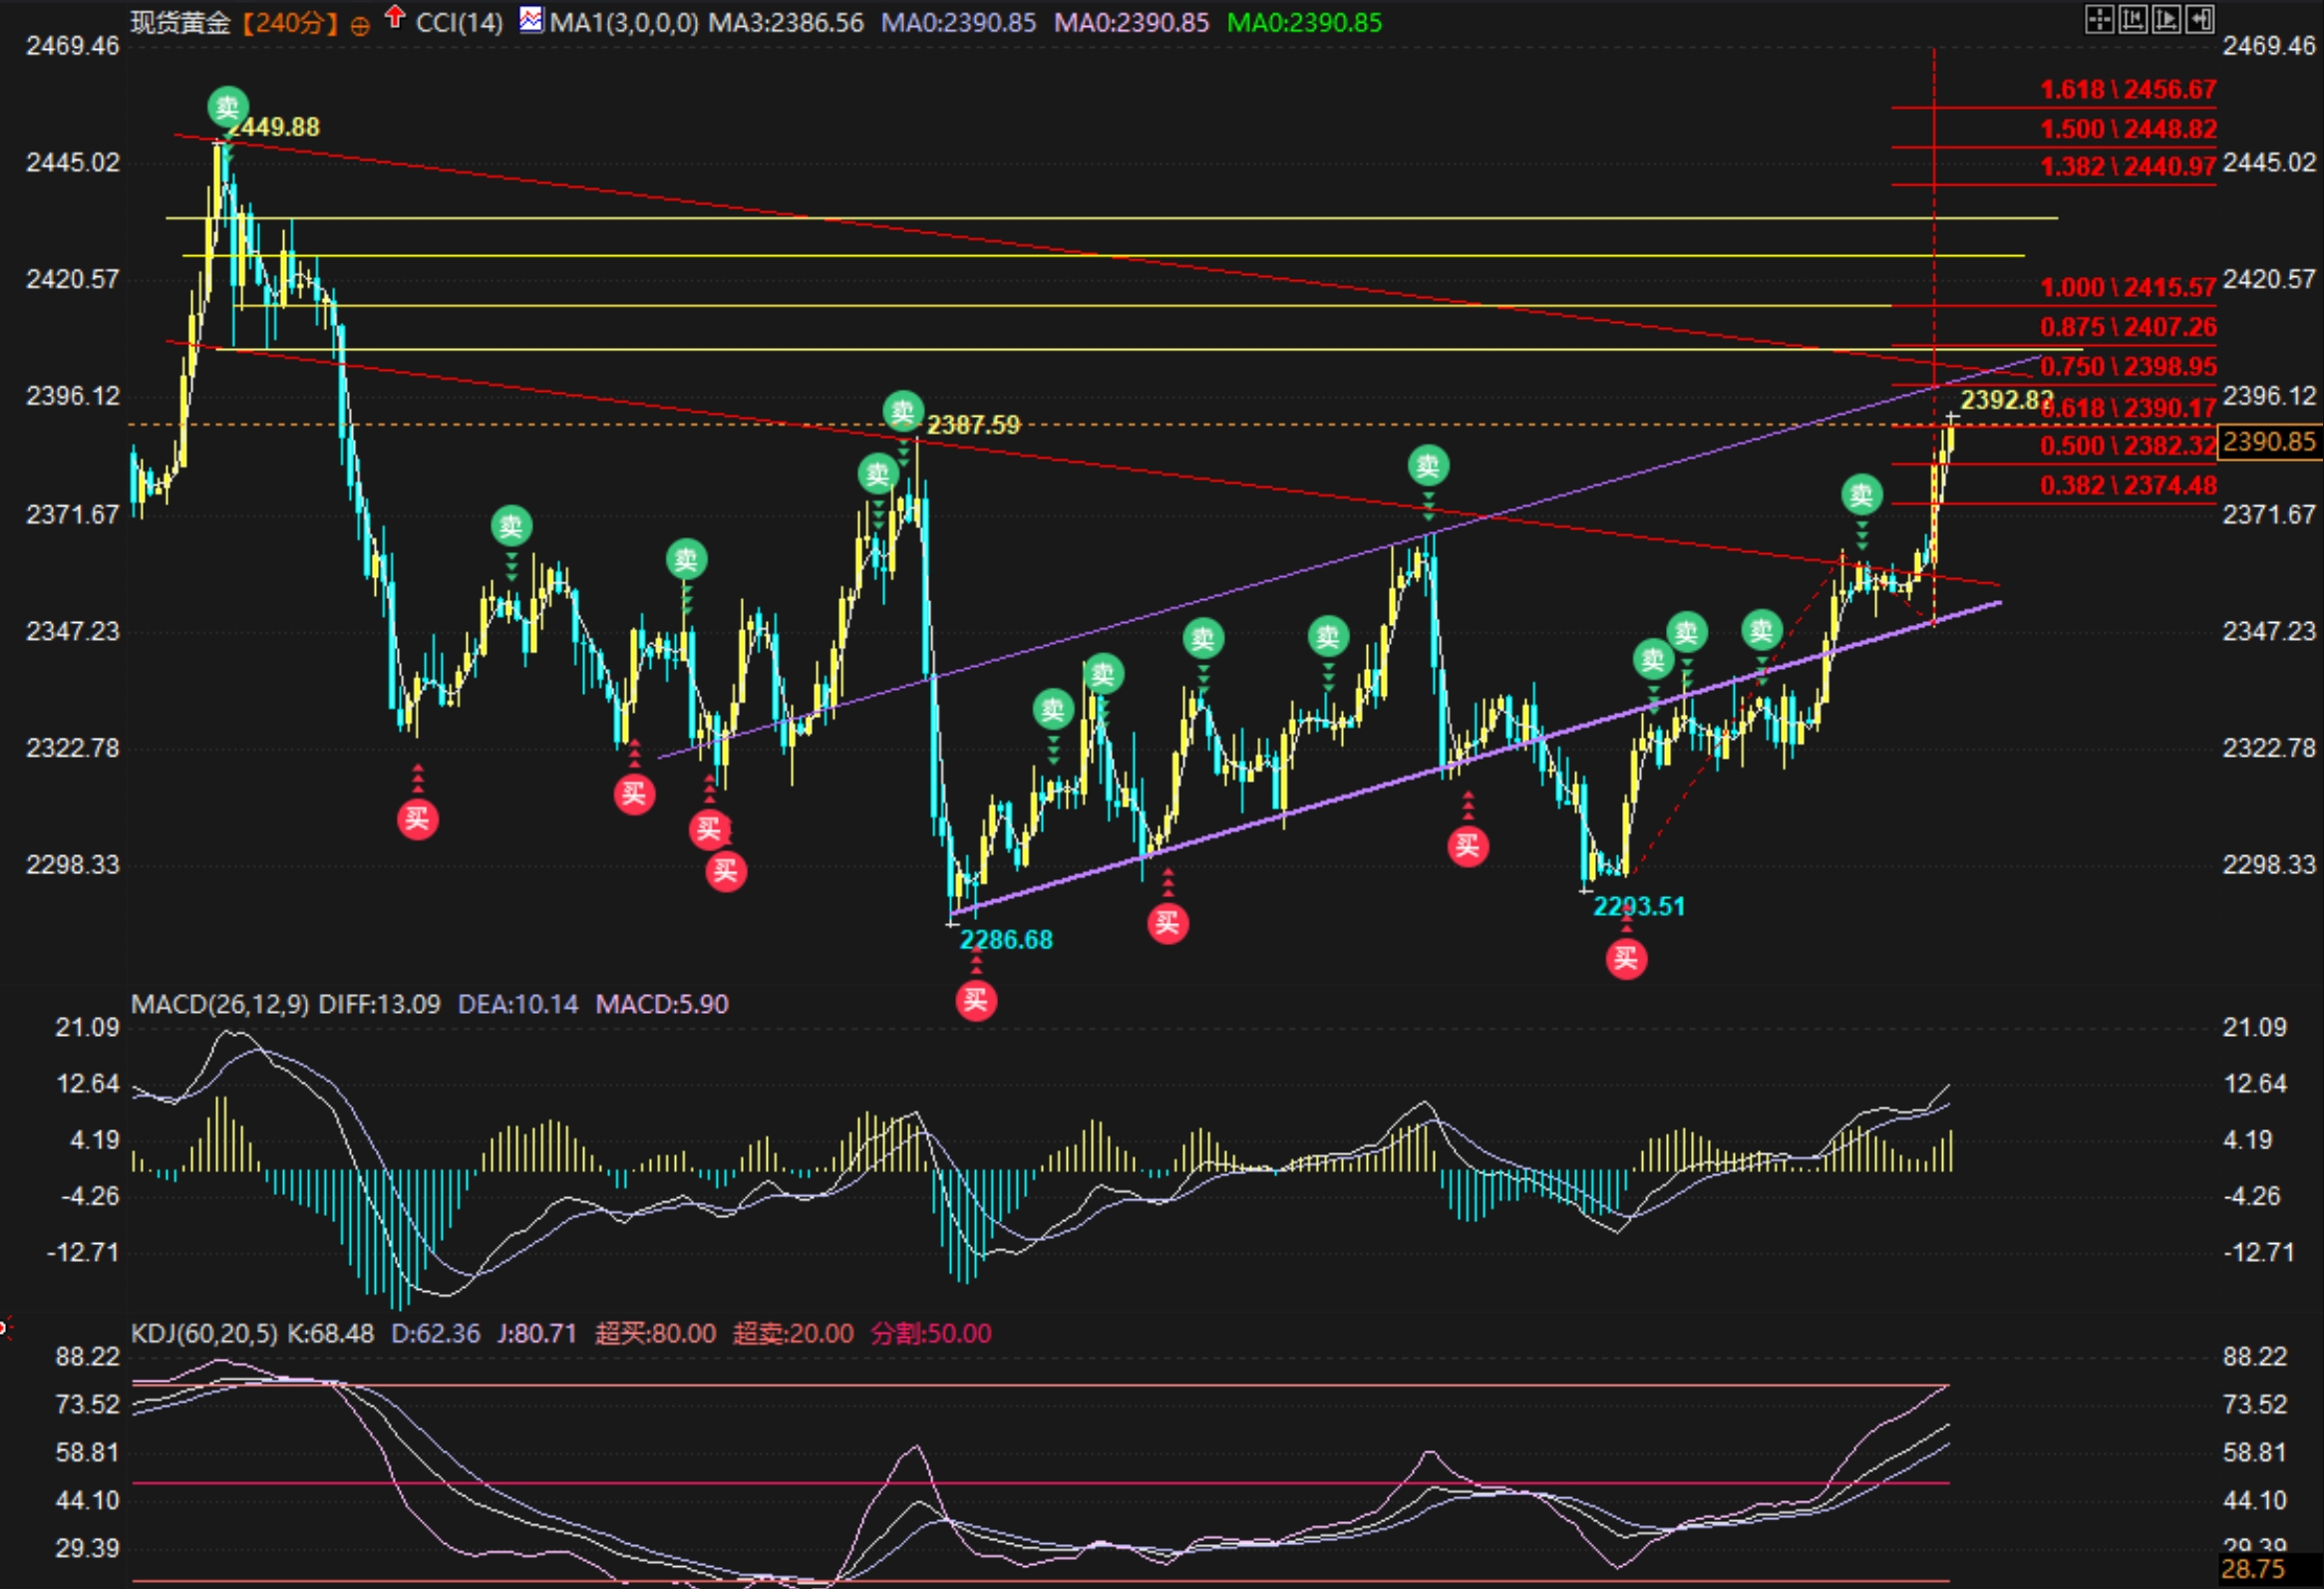
4-hour technical analysis of spot gold
From the medium to long term perspective, gold is still in an upward trend. However, due to the expectation of the Federal Reserve's interest rate cuts often being suppressed by the Federal Reserve or strong data, the rise of gold is getting closer to historical highs. If there are serious overbought and divergence signals, it may restart a significant downward trend and pull the market back into a volatile pattern.
This week (July 8th to July 12th), there were quite a few fundamentals, including Federal Reserve Chairman Powell's biannual congressional testimony, and four other Federal Reserve officials who also participated in the event to give speeches, focusing on their expectations of the Fed's interest rate cut prospects. In addition, CPI data from China, Europe, and the United States were also released this week, providing guidance for the market on how to see the inflation outlook.
Monday, July 8th: 14:00 German May Retail and Trade Accounts, 17:00 Eurozone Investor Confidence Index, 23:00 New York Fed 1-year Inflation Expectation+3-year Inflation Expectation+1-year Gold Gain Expectation. In addition, due to the US holiday on Thursday, July 4th, the CFTC position report has been postponed for one trading day until the release of the US East Monday, specifically at 03:30 am Beijing time on Tuesday 8th.
On Tuesday, July 9th, the main focus was on the remarks of Federal Reserve officials, including speeches by Federal Reserve Director Barr at 21:15, and particularly: at 22:00, Federal Reserve Chairman Powell delivered a semi annual monetary policy testimony to the Senate Banking Committee. New York time (01:30 on the 10th) Federal Reserve Director Bowman gave a speech.
Wednesday, July 10th: 09:30 China CPI and PPI, 10:00 New Zealand interest rate resolution, 18-20 OPEC monthly crude oil market report, 22:30 US EIA crude oil inventory report, and major consumer sentiment indices in multiple countries after 23:00.
Thursday, July 11th: 14:00 German CPI+UK GDP and industrial output and trade accounts, 17:30 South African gold production, 16:00 International Energy Agency (IEA) releases monthly report, 20:30 US CPI report+initial unemployment claims, 23:30 FOMC voting committee member Bostek participates in Q&A, and New York time (01:00 on the 12th) St. Louis Fed Chairman Musalem delivers a speech on the economy.
Friday, July 12th: 20:30 US PPI, 22:00 US University of Michigan Consumer Confidence Index.
Tips:This page came from Internet, which is not standing for FXCUE opinions of this website.
Statement:Contact us if the content violates the law or your rights