Technical analysis: GBP/USD looks at 1.3000, EUR/GBP is consolidating
On Friday (July 12th) during the European trading session, GBP/USD accelerated its upward trend above the resistance level of 1.2900. EUR/GBP has fallen and is currently consolidating above the 0.8400 area, resulting in losses.
The pound/dollar is attempting to rise again above 1.2950. On the GBP/USD hourly chart, there is a key bullish trend line forming support around 1.2910. The EUR/GBP trades in the bearish area below the 0.8440 pivot point. On the hourly chart, there is a breakthrough above the resistance level around 0.8425.
GBP/USD Technical Analysis
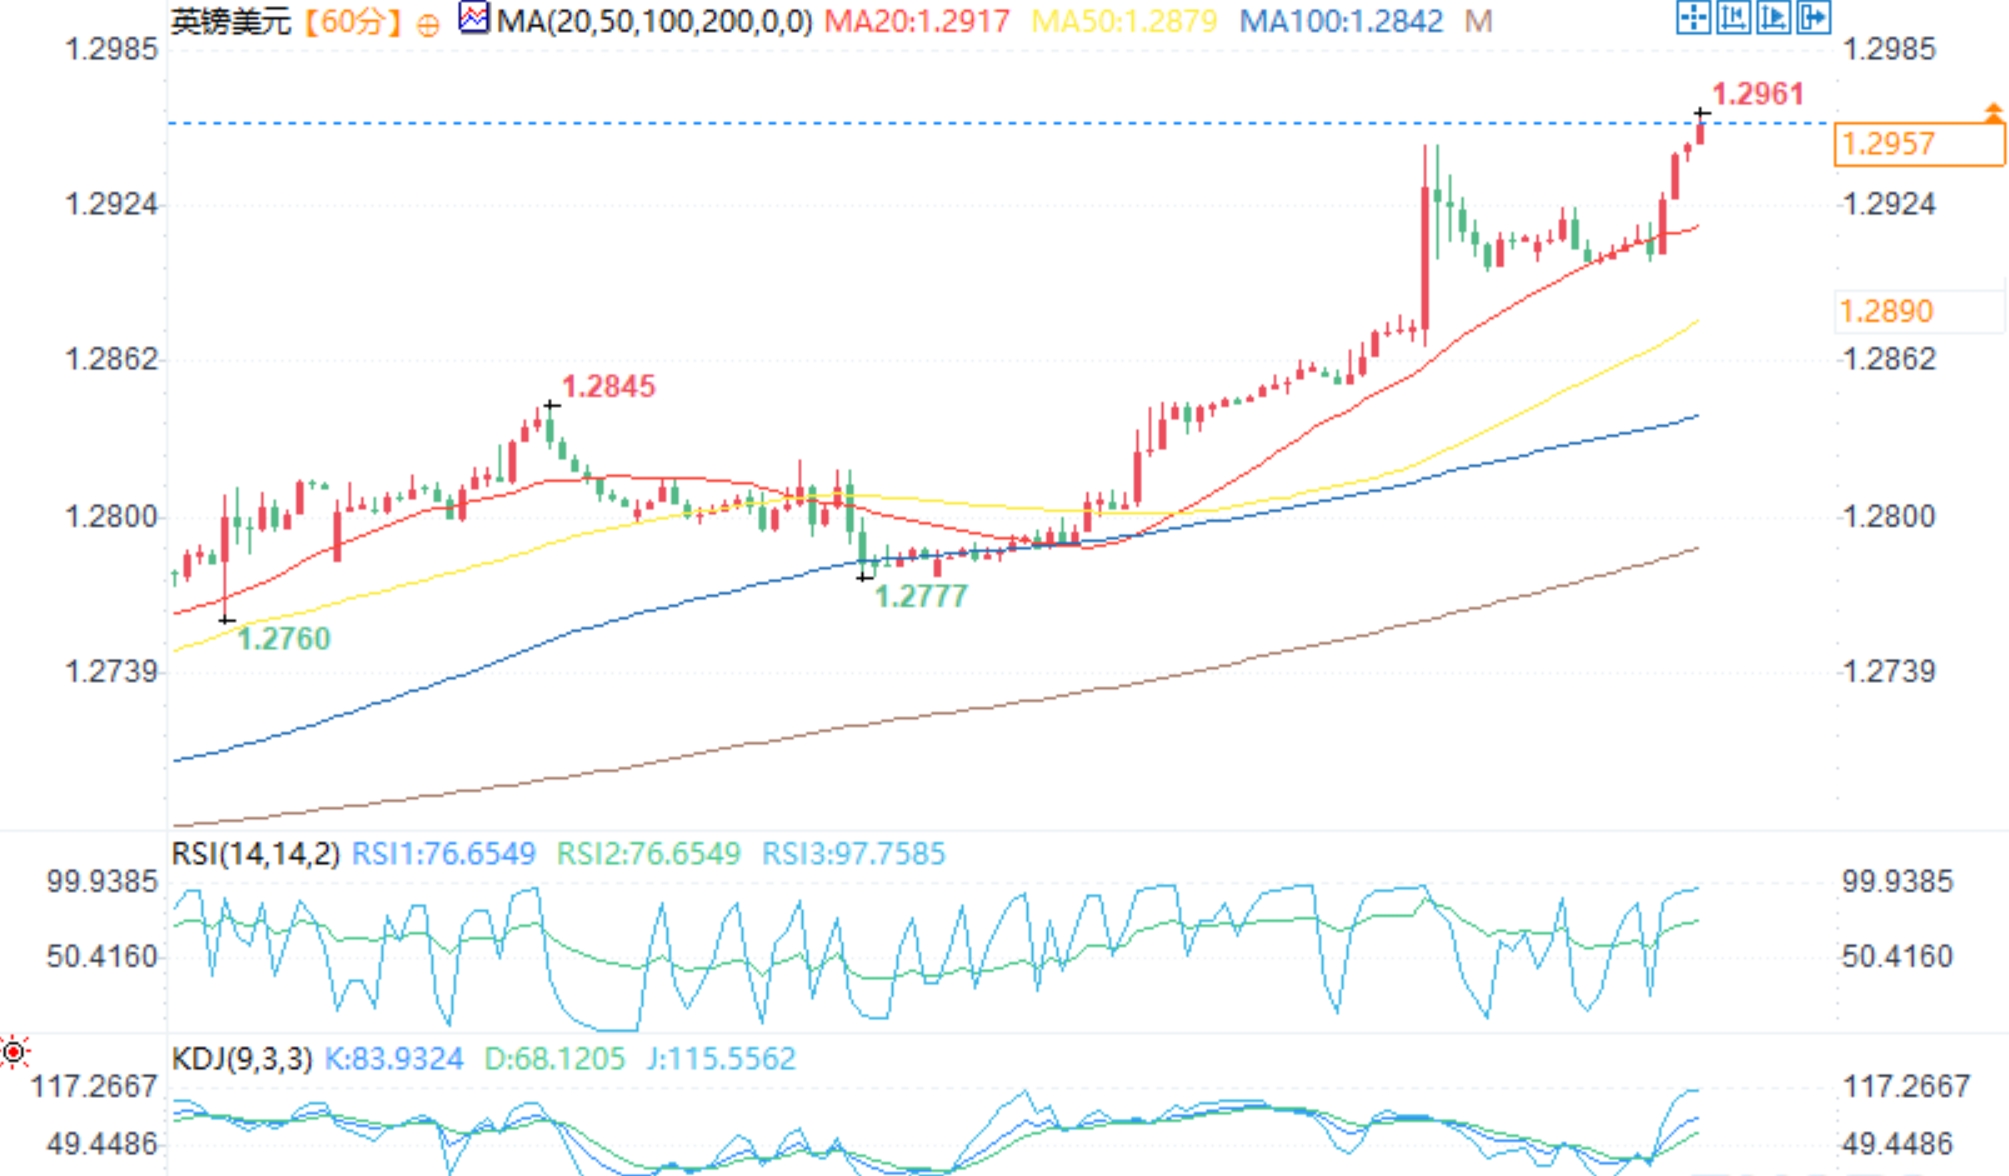
GBP/USD hourly chart
On the hourly chart of GBP/USD, there is still good buying demand for the currency pair above 1.2750, and GBP/USD has started to rise sharply above the 1.2850 area.
The bulls pushed the currency pair above the 50 hour simple moving average and 1.2900. The currency pair even climbed above 1.2925, with a maximum trading price of 1.2949. Recently, there has been a slight decline below the 23.6% Fibonacci retracement level, which moved upwards from the low of 1.2775 to the high of 1.2949, but bulls are active above 1.29700.
On the upward trend, the GBP/USD chart shows that the currency pair is facing resistance around 1.2925. The next major resistance level is around 1.2950.
If the closing price is above the resistance level of 1.2950, it may open the door to move towards 1.3000. Any further increase could push GBP/USD towards 1.3200. On the downside, a key support level has formed near the bullish trend line of 1.2910.
If it falls below 1.2910, the currency pair may accelerate its downward trend. The next major support level is 1.2860. It is close to the 50% Fibonacci retracement level moving upwards from the low of 1.2775 to the high of 1.2949.
The next key support level is around 1.2840, and the currency pair may test 1.2810. Any further decline could lead to the currency pair falling towards the support level of 1.2775.
EUR/GBP Technical Analysis
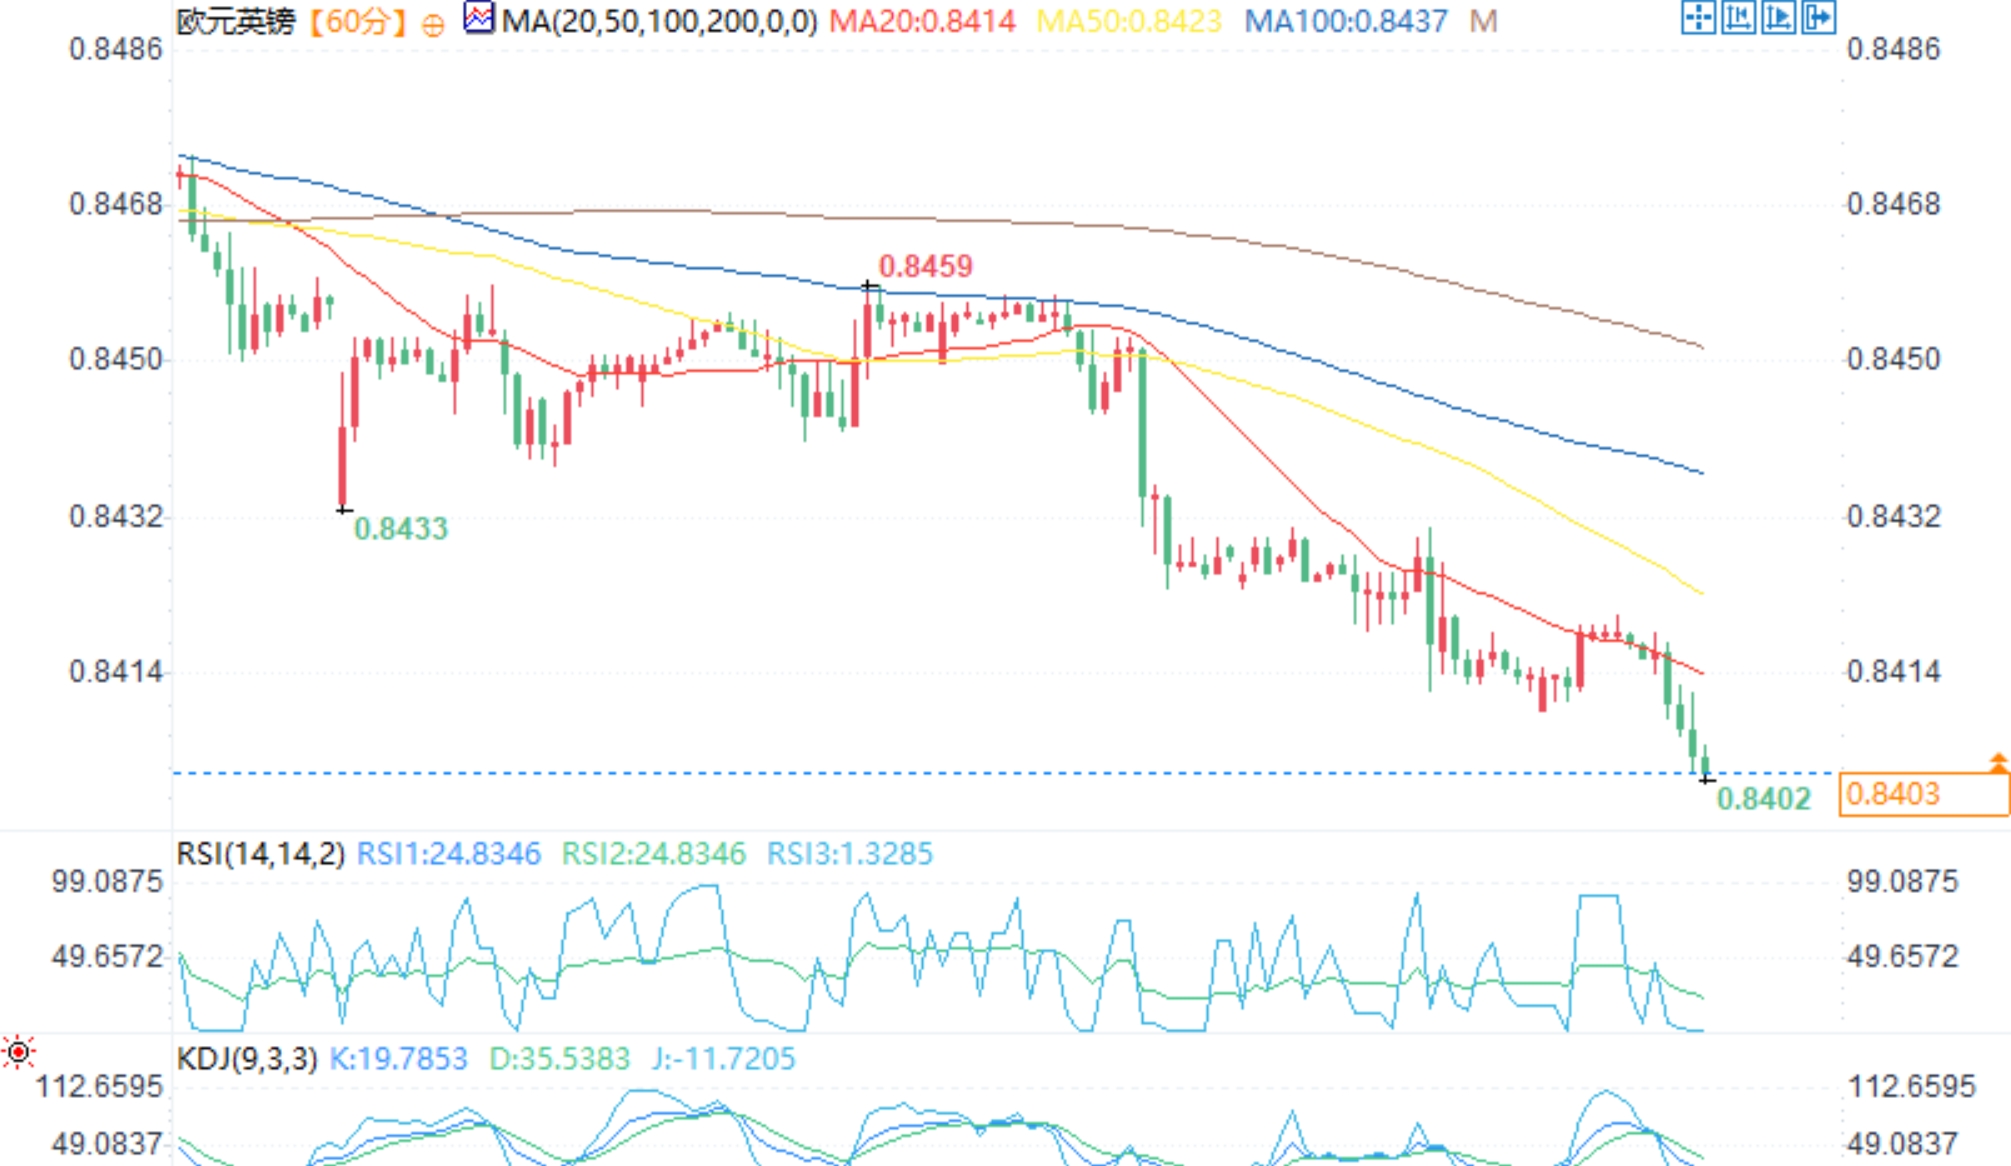
EUR/GBP hourly chart
On the EUR/GBP hourly chart, the currency pair steadily declines from a position far above 0.8460. The euro/pound fell below the support level of 0.8440.
The EUR/GBP trend chart shows that the currency pair even fell below 0.8824 and tested 0.8410. The currency pair is currently consolidating, with trading prices below the 50 hour simple moving average. Recently, the currency pair has seen a slight increase near the bearish trend line of 0.8425.
The currency pair is currently facing resistance near the 23.6% Fibonacci retracement level in the downward trend from the fluctuating high of 0.8459 to the low of 0.8412. The next major resistance level may be 0.8435.
The 50% Fibonacci retracement level from the oscillation high of 0.8459 to the low of 0.8412 is also at 0.8435. A closing price above 0.8435 may accelerate the upward trend. In the above situation, the bulls may test 0.8460. Any further gains could push the currency pair towards the level of 0.8500.
The immediate support level is around 0.8410. The next major support level is around 0.8400. If it falls below the support level of 0.8400, there may be more downturns. In the above situation, the currency pair may fall towards the support level of 0.8360.
Tips:This page came from Internet, which is not standing for FXCUE opinions of this website.
Statement:Contact us if the content violates the law or your rights