COMEX Gold Technical Analysis on November 21st
At the end of the Asian session on Thursday (November 21), COMEX gold traded near $2662. On the basic level, the risk aversion caused by the Russia-Ukraine conflict continued to rise, which was an important reason for the rise of gold prices in the short term.
Even if the US dollar index rises again, it has not caused the gold price to fall, and at the same time, the expectation of the Federal Reserve's interest rate cut in December has slowed down. The short-term market is trading in safe haven sentiment, waiting for the direction to be chosen after the sentiment cools down.
We need to pay attention to the number of initial jobless claims in the United States and the speeches of Federal Reserve officials during the day. Regarding the impact on gold, in the medium-term direction, as the fundamentals only catalyze emotions and have not shown any substantial changes, the daily rebound will be hindered around $2685.
There is a possibility of a second downward trend, and if you stand at $2685 and cooperate with the bullish fundamentals, you may return to the long position. Do not blindly chase after the rise and kill the fall.
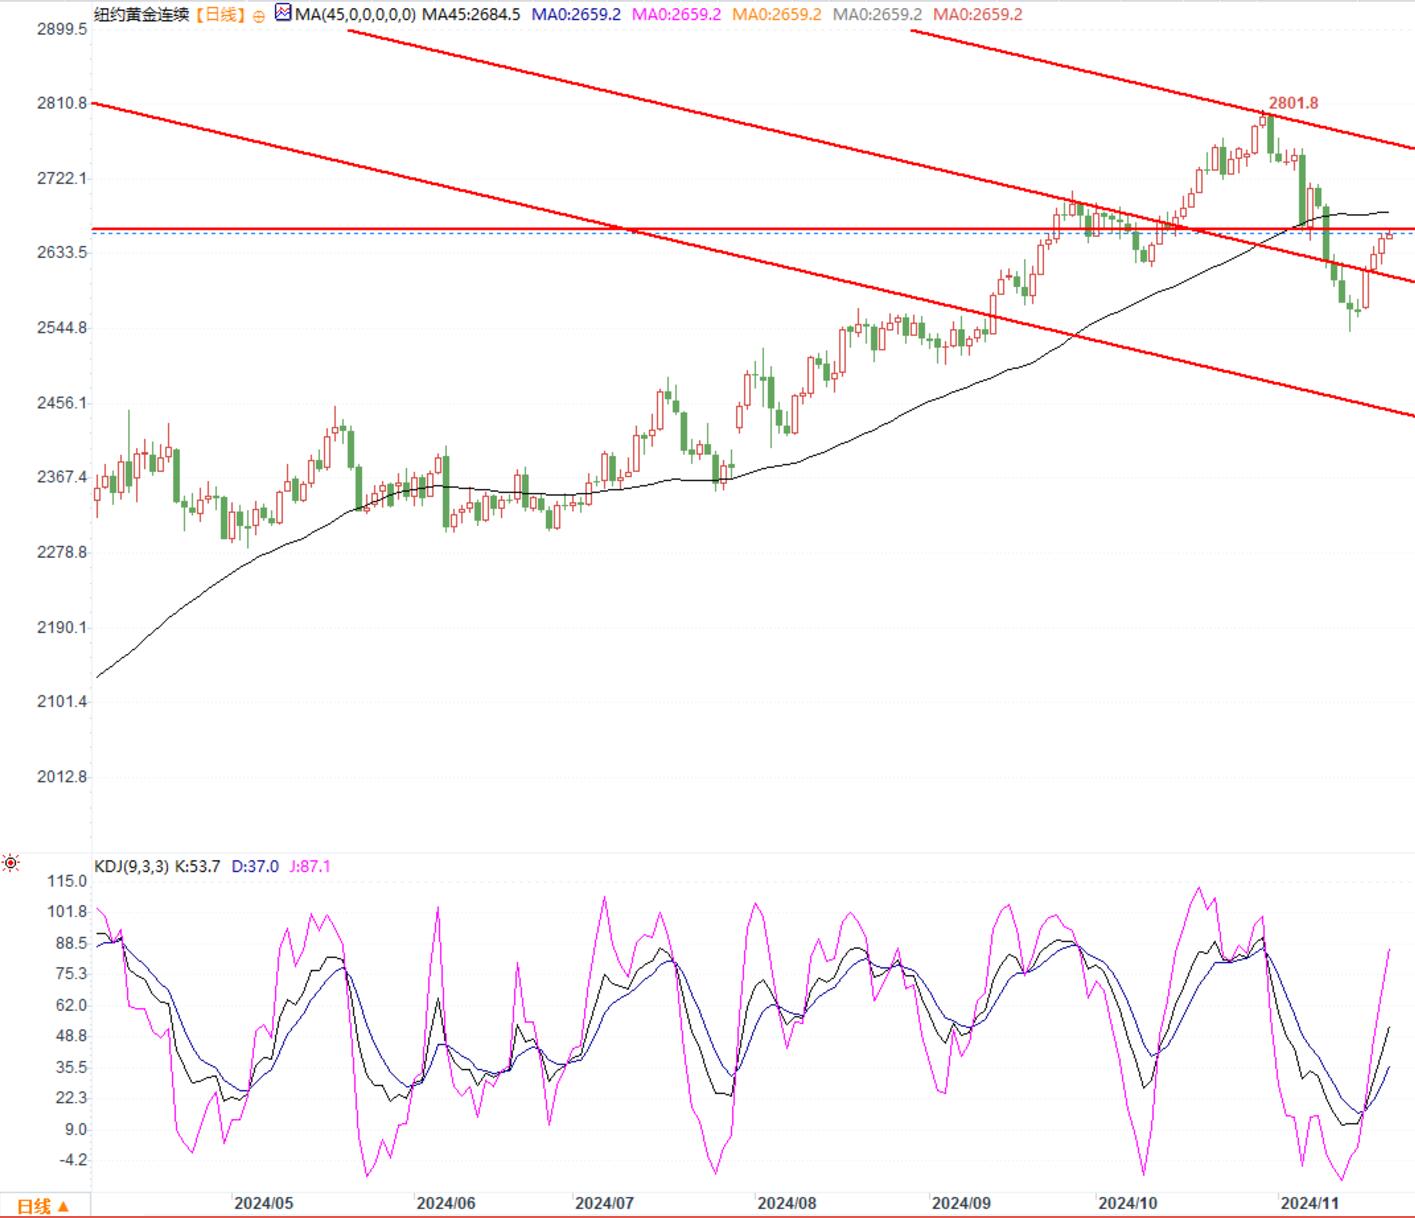
From a technical perspective, the gold daily chart has been bullish for four consecutive days, and the weekly chart is close to swallowing last week's decline, indicating that the resistance of bulls is still strong. However, the daily chart has not broken through the pressure of the moving average, and the indicator has only entered the correction range from overbought. The opening of the daily level Bollinger Bands has widened, and the central axis is around $2700.
If the rebound cannot be broken through in this round, it is not ruled out that there is a possibility of returning to the lower track. We will mainly wait for stress testing and support $2638 below. If it falls below, we will wait for a second retracement.

COMEX Gold Daily Chart
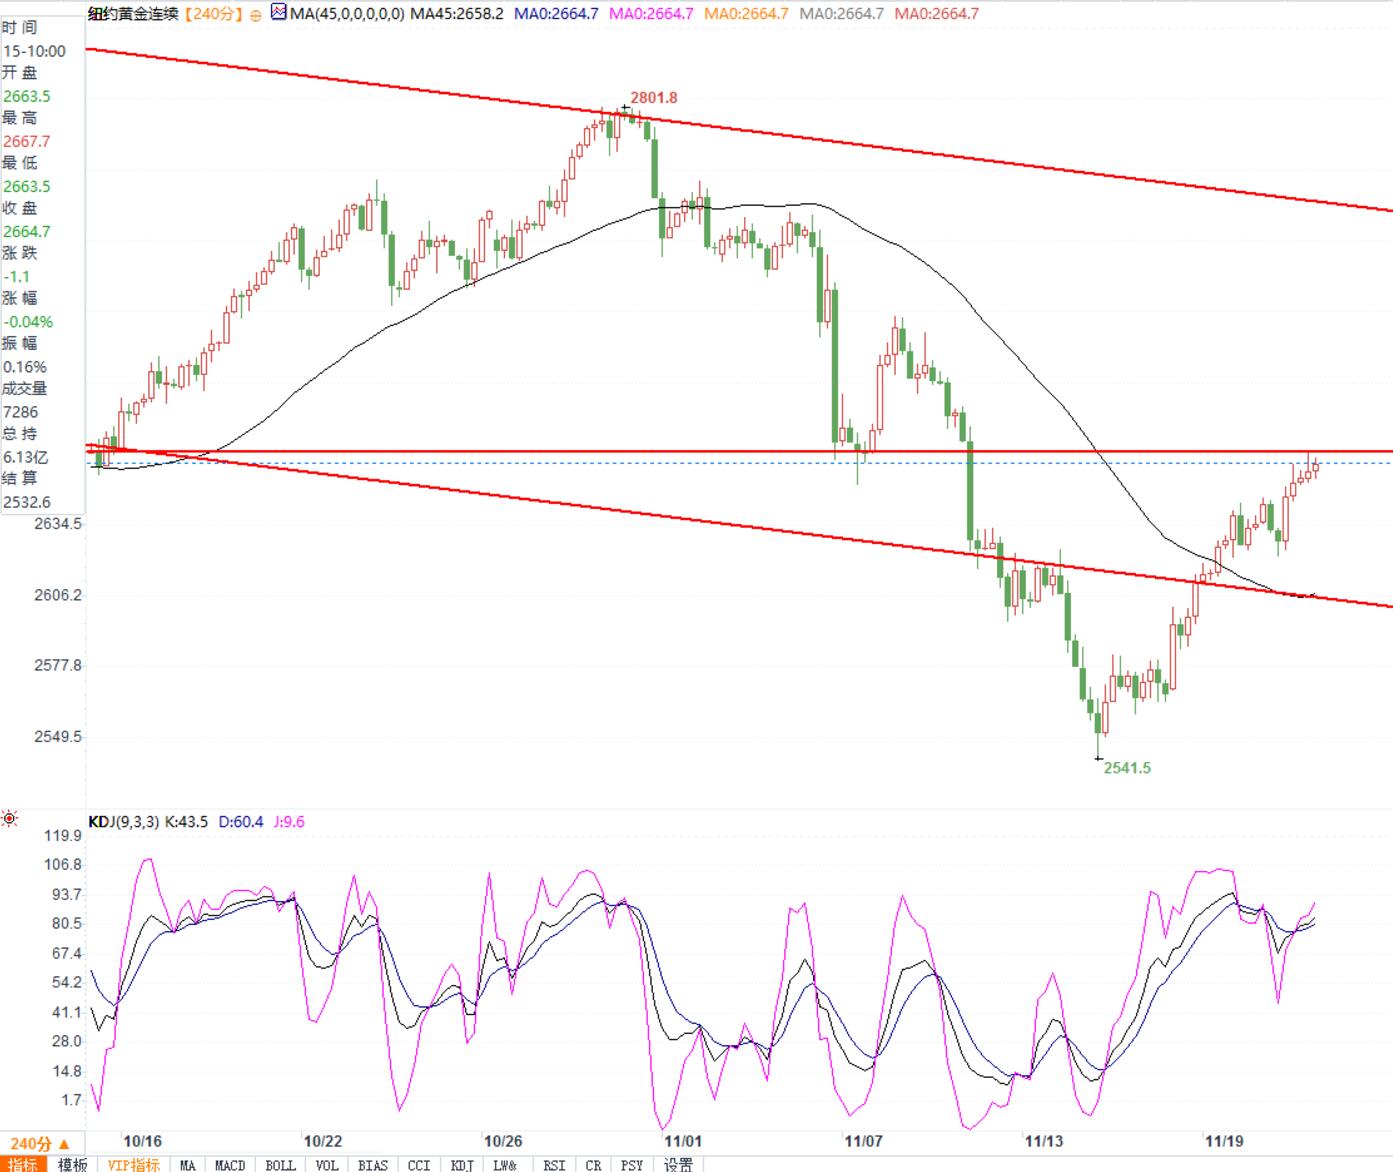
At the 4-hour level, this is still an oversold rebound, as the moving average has not turned upwards and the KDJ indicator has entered a high level of operation, causing the 4-hour price to enter the left horizontal pressure range
If unable to break through, wait for a retracement as the main strategy. If breaking through, accelerate the rebound, with upper pressure around $2660 and lower support at $2630.

COMEX Gold 4-hour chart
Tips:This page came from Internet, which is not standing for FXCUE opinions of this website.
Statement:Contact us if the content violates the law or your rights
