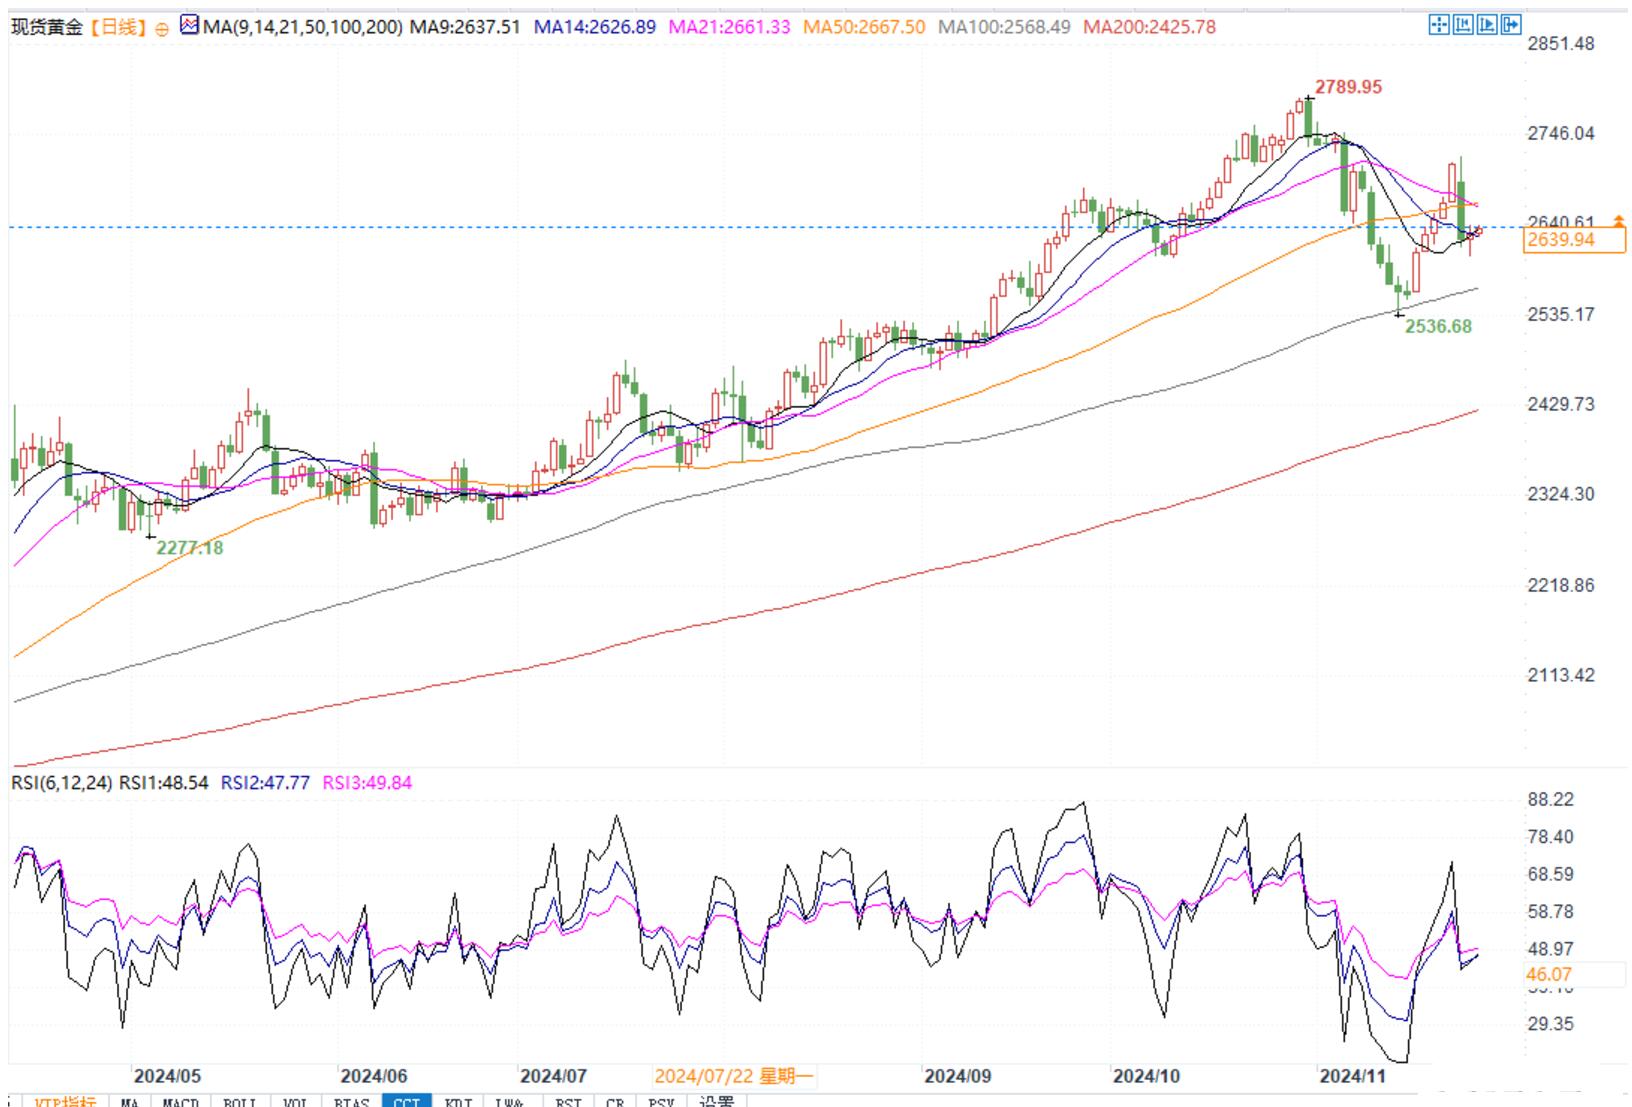
The gold price is approaching the resistance of $2645, and if it breaks through or continues to rise, it will challenge $2700!
During Wednesday's Asian session, gold prices attracted some follow-up buying and are expected to continue rising on the basis of an overnight rebound to around $2600 or a one week low. The protracted Russia-Ukraine conflict has brought about continuous geopolitical risks, as well as concerns about the tariff plan of President elect Trump of the United States, which has pushed some safe haven funds to flow to precious metals for the second day in a row.
At the same time, despite the optimistic macroeconomic data in the United States on Tuesday, the US dollar consolidated near the lower limit of the weekly range, becoming another factor supporting gold prices. That is to say, the prospect of a less dovish attitude from the Federal Reserve may limit this unprofitable gold. Traders are still waiting for November inflation data from the United States to gather clues about future interest rate cuts before making new directional bets around gold.
Precious metal analyst Haresh Menghani said that from a technical perspective, the good rebound of gold from the 61.8% Fibonacci retracement level of the recent recovery on Tuesday, as well as the subsequent strength, is beneficial for bullish traders. However, the oscillation indicators on the daily chart have not yet confirmed a positive trend and indicate that the uptrend is more likely to encounter strong resistance near the 100 week moving average on the 4-hour chart. The above resistance level is locked around the $2645 area, above which the gold price may further climb to the $2665 area and eventually reach the $2677-2678 level, with the goal of recovering the $2700 integer level.
On the other hand, the $2624-2622 region may provide some support before the $2600 mark. If the gold price effectively falls below $2600, it will be seen as a new trigger for bearish traders and further decline towards the 100 day moving average near the $2569-2568 range. Subsequently, there is a monthly fluctuation low point, centered around the $2537-2536 range. Failure to hold onto the above support levels will be seen as a new trigger for bearish traders and lay the foundation for gold prices to recover from a corrective decline around $2800 (the historical peak reached in October).

Daily chart of spot gold
Tips:This page came from Internet, which is not standing for FXCUE opinions of this website.
Statement:Contact us if the content violates the law or your rights
