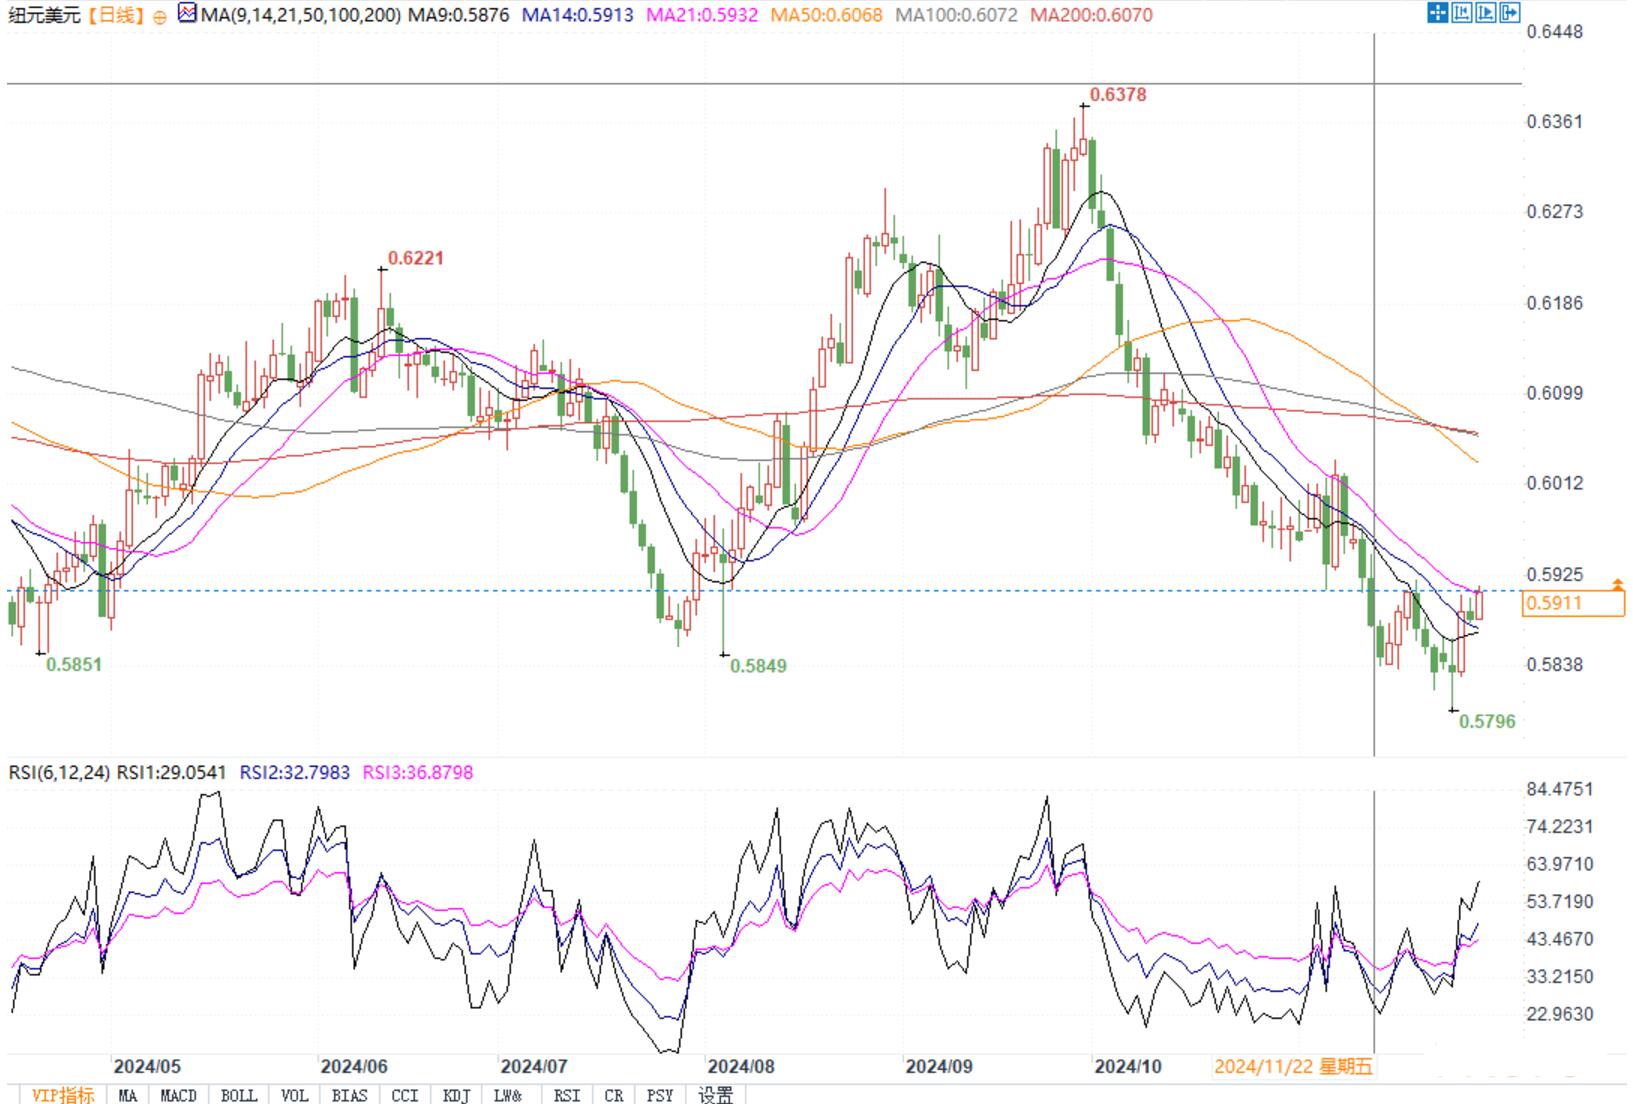
The New Zealand dollar is approaching the upper limit of the upward channel at 0.5920, and if it breaks through, it will further challenge 0.60 and 0.6038!
NZD/USD has recovered from its recent decline and is currently trading at around 0.5910. Forex analyst Akhtar Faruqui said that careful observation of the daily chart indicates that as the currency pair breaks through the downward wedge pattern, it may shift from bearish to bullish. Meanwhile, another downward channel pattern has formed, and breaking through this channel will further strengthen the bullish outlook.
In addition, the New Zealand dollar has surpassed the 9-day and 14 day moving averages (EMAs) against the US dollar, indicating strong short-term upward momentum. However, the 14 day Relative Strength Index (RSI) remains below the 50 level, indicating that the prevailing bearish sentiment is still at work. A level above 50 will confirm a shift in bullish sentiment.
On the positive side, the New Zealand dollar is testing the upper limit of the downward channel pattern at the 0.5920 level against the US dollar. Breaking through this level may pave the way for the currency pair to target the psychological level of 0.6000, followed by resistance at 0.6038.
The immediate support levels for the New Zealand dollar against the US dollar are located near the 14 day and 9-day moving averages of 0.5875 and 0.5872, respectively. Breaking below these levels may exert downward pressure on the currency pair, with the next key 'pullback support' level being 0.5850, followed by a two-year low of 0.5772, last seen in November 2023.

NZD/USD daily chart
Tips:This page came from Internet, which is not standing for FXCUE opinions of this website.
Statement:Contact us if the content violates the law or your rights
