Non farm payroll tests Trump's victory, causing gold prices to hit their biggest monthly decline in a year
On Monday (December 2nd) morning trading in the Asian market, spot gold fluctuated slightly lower and is currently trading at $2646.95 per ounce. Gold prices rose slightly last Friday, boosted by the decline in the US dollar and ongoing geopolitical tensions. However, November still recorded its largest monthly decline since September last year, mainly due to post election selling triggered by Trump's victory.
Spot gold climbed 0.5% to $260.26 per ounce last Friday, but last week's decline will exceed 2% as gold prices fell more than 3% on Monday. Despite attempts to rebound in the following trading days, the decline was not reversed, and investors need to be wary of further downside risks in gold prices.
In November, spot gold fell 3.4%, the largest monthly decline since September 2023, due to the "Trump excitement" that boosted the US dollar earlier in November, blocking the rise of gold and triggering post election selling.
The US dollar index fell to a new low in over two weeks last Friday, but still rose 1.8% in November as Trump's victory on November 5th fueled expectations of large fiscal spending, increased tariffs, and tightened border controls.
Gold is currently under pressure as raising tariffs could stimulate inflation and lead the Federal Reserve to adopt a cautious attitude towards further interest rate cuts.
Jim Wyckoff, senior market analyst at Kitco Metals, said it is currently uncertain how the tariffs promised by Trump will be implemented. However, the uncertainty of this matter, namely tariffs that may slow down economic growth, is actually beneficial to the gold market from a safe haven perspective.
Analysts say that policies promising to crack down on illegal immigration may also lead to a resurgence of inflation. The stronger than expected economic data has also increased people's bets that the Federal Reserve will slow down the pace of interest rate cuts when approaching neutral rates.
According to the CME FedWatch Tool, traders believe there is a 66% probability that the Federal Reserve will cut interest rates by 25 basis points at its meeting on December 17-18, but the probability of another rate cut in January is only 17%.
Ole Hansen, head of commodity strategy at Saxo Bank in Denmark, said in a report, "The ongoing global uncertainty continues to drive demand for gold as a safe haven asset
The next important US economic data will be released on Friday, which is the November employment report. Investors will have a new perspective on the health of the US economy, and this report may help determine the trajectory of interest rates in the coming months.
A series of strong economic data, including a strong employment report in September, have raised concerns that if the Federal Reserve cuts interest rates too much, inflation may rebound, thus reversing the progress made in suppressing prices over the past two years.
Investors say that although most of them welcome evidence of economic strength, if the non farm payroll data released on December 6th performs strongly again, it may further weaken expectations of a Fed rate cut and intensify vigilance against inflation.
Angelo Kourkafas, Senior Investment Strategist at Edward Jones, stated that the non farm payroll data "will provide a clearer potential trend chart, which is crucial as there is a lot of debate and uncertainty surrounding the path of the Federal Reserve's interest rates.
Federal Reserve Chairman Powell stated earlier in November that the Fed does not need to rush to lower interest rates, citing a robust job market and inflation rates still above the 2% target. Sameer Samana, Senior Global Market Strategist at the Investment Research Institute of Wells Fargo, said that the Federal Reserve is "starting to loudly question how much more loose policy the economy, especially the labor market, really needs.
Anthony Saglimbene, Chief Market Strategist at Ameriprise Financial, stated that economists surveyed by Reuters expect an increase of 183000 non farm jobs in November. If the report far exceeds expectations, it could shake people's confidence in December's actions and severely impact the stock market. If the employment report is stronger than expected, there may be a slight sell-off in the US stock market.
In addition to the non farm payroll report, this week will also bring economic data such as the US November ISM Manufacturing PMI, US October JOLTs job vacancies, US November ADP employment changes, US November ADP employment changes, US November ISM Non Manufacturing PMI, US October trade account, etc. In addition, several Federal Reserve officials, including Federal Reserve Chairman Powell, will give speeches this week, and investors also need to pay attention.
Among them, the November ISM manufacturing PMI data for the United States will be released on Monday, and this trading day will also see speeches from Federal Reserve Governor Waller and New York Fed President Williams, which investors need to pay attention to. In addition, investors need to continue to pay attention to relevant news on the geopolitical situation.

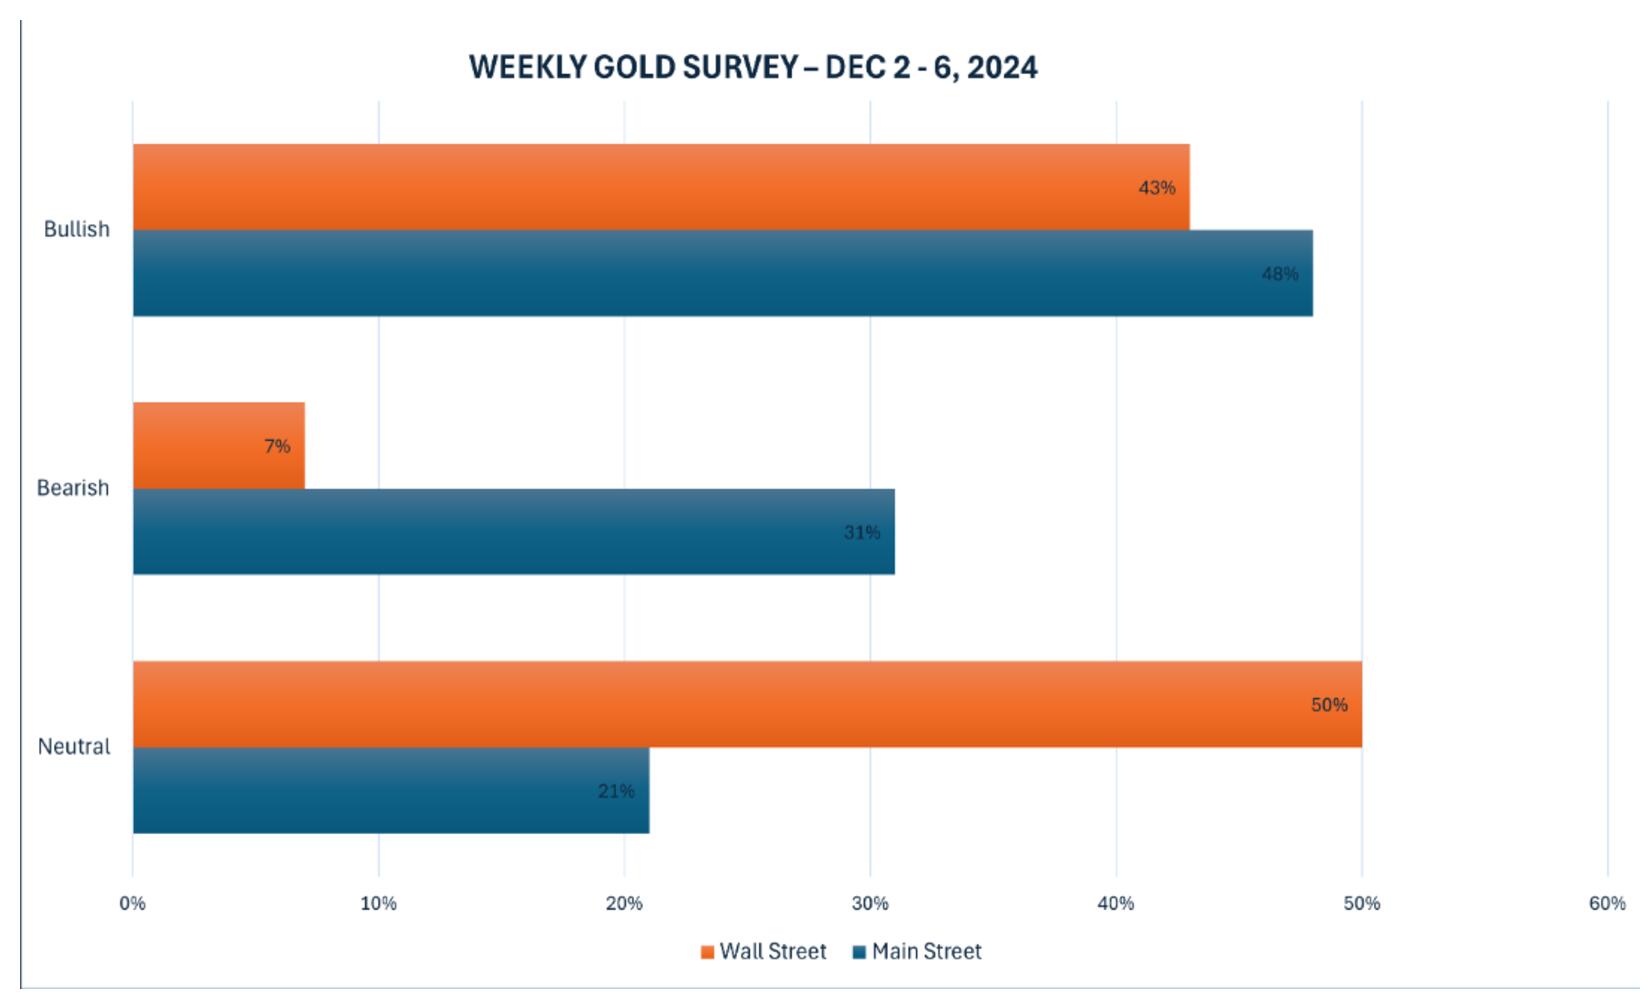
The latest KITCO report shows that Wall Street analysts' bearish sentiment has decreased, with most analysts leaning towards neutral or bullish trends in the future, while most retail investors tend to be bullish.
In the survey, a total of 14 analysts participated, of which 6 (43%) predicted that gold prices would rise in the coming week, 7 (50%) predicted that gold would further consolidate, and only 1 (7%) predicted that gold prices would fall. In an online survey, out of 199 participants, 96 (48%) expect gold prices to rise, 61 (31%) expect prices to fall, and the remaining 42 (21%) expect gold to consolidate sideways.
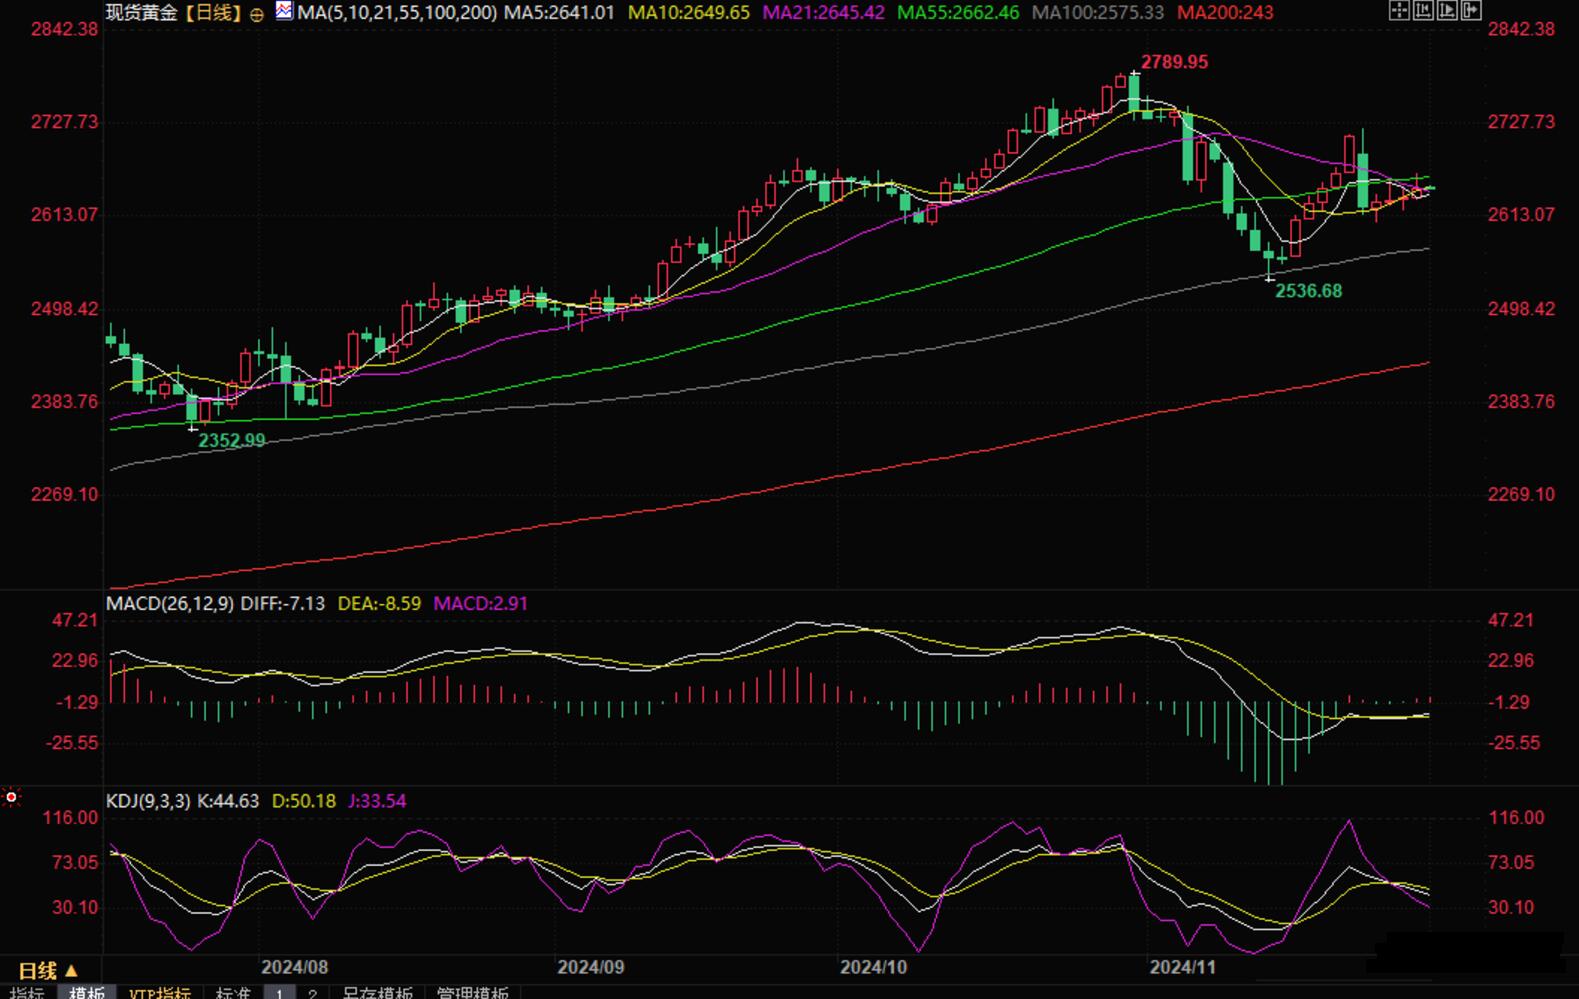
From a technical perspective, the trend of gold prices last week was somewhat similar to a bearish "flag", and investors need to be wary of the possibility of gold prices re exploring the 100 day moving average. Currently, the support level is around 2575, and if it breaks this support level, it may further look towards the 200 day moving average around 2435.
Pay attention to the resistance near the 55 day moving average 2662.46. If it stays above this level, it will weaken the bearish signal in the future.

Daily chart of spot gold
Tips:This page came from Internet, which is not standing for FXCUE opinions of this website.
Statement:Contact us if the content violates the law or your rights
