Technical analysis of USD/JPY, AUD/USD, NZD/USD, and USD/CHF on December 3rd
On Tuesday (December 3rd) during the European trading session, the US dollar index fell slightly, closing at 106.2170, a decrease of 0.16%.
After a large amount of strong US economic data was released, the lack of signs of a strengthening US dollar indicates that market expectations for three interest rate cuts before the end of 2025 remain largely unchanged. We may see the US dollar on the defensive at least until next week's release of the US Consumer Price Index (CPI).
The comments from Federal Reserve officials have given mixed signals, with Federal Reserve Chairman Waller leaning towards a rate cut, while Federal Reserve Chairman Bostic has taken a more ambiguous stance. At the same time, the ISM data is mixed, increasing uncertainty.
The following is a technical analysis of several currency pairs, including USD/JPY, AUD/USD, NZD/USD, and USD/CHF.
USD/JPY traders are seeking upward space

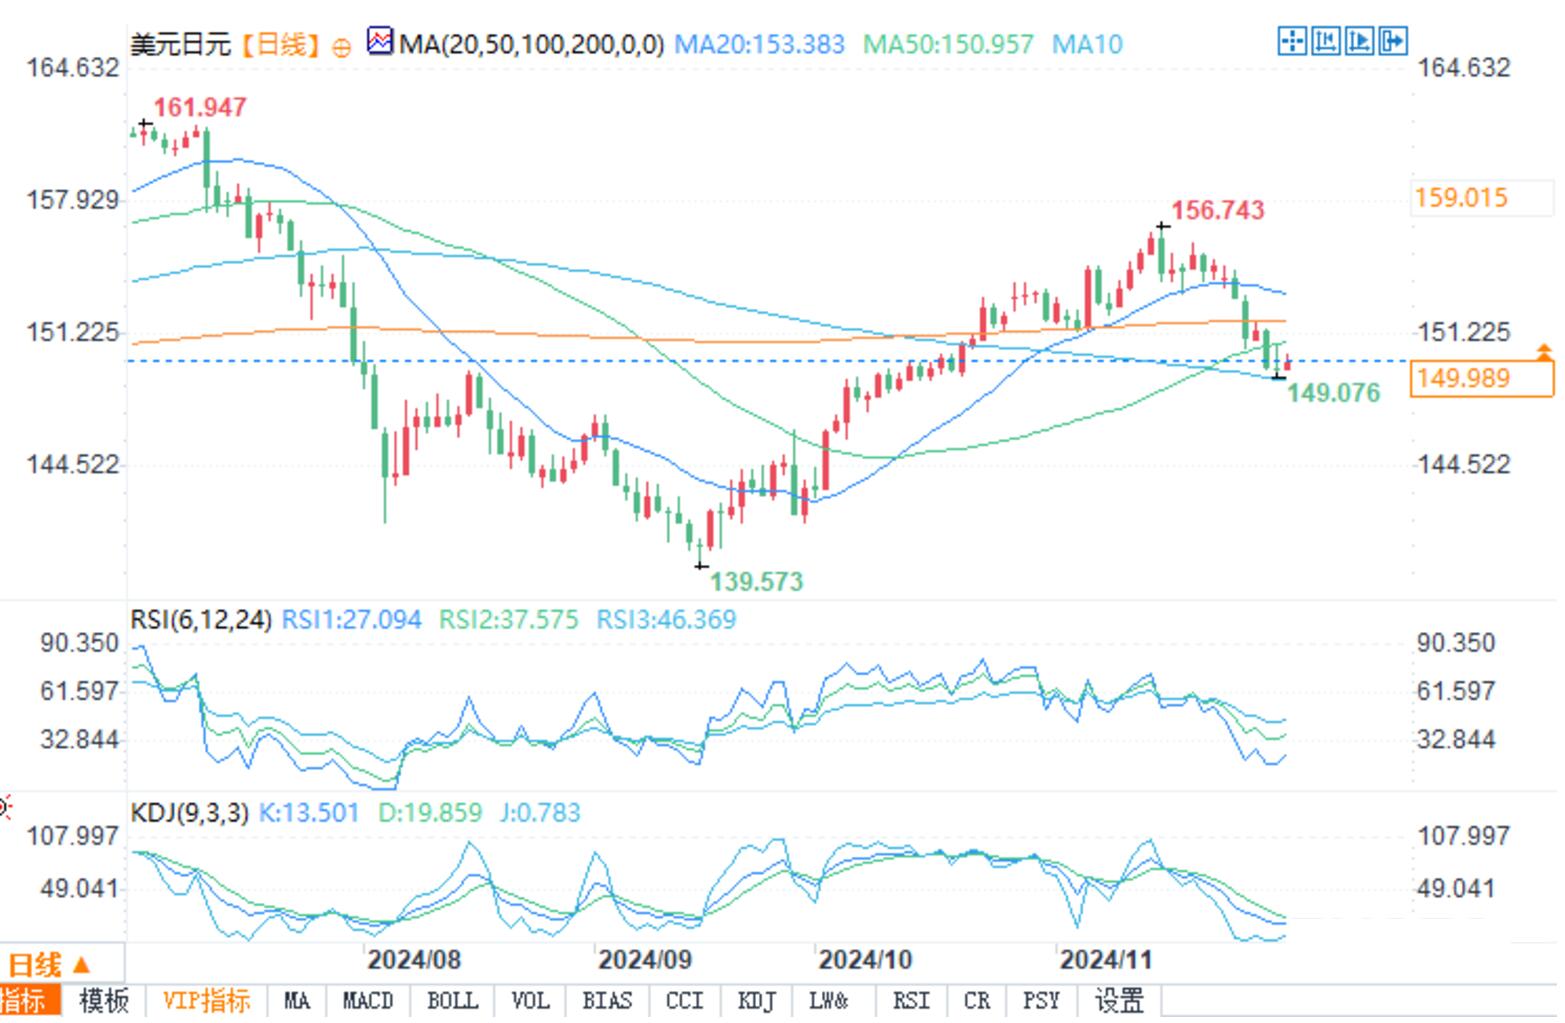
USD/JPY daily chart
The US dollar/Japanese yen experienced a volatile trading day yesterday, initially rising and then falling back. Although the yield has slightly increased, there has still been this decline.
The decline of USD/JPY caused it to fall below the 38.2% retracement level and psychological support level of 150.00, which moved upwards from the September low (150.18). The selling momentum continues, pushing the price towards the 100 day moving average (currently at 148.95). Before finding a buyer, the currency pair triggered a higher rebound.
In today's trading, the recovery momentum of the currency pair was strong, and the price climbed to an intraday high of 149.92. To continue to see the upward trend, the currency pair must return to the 150.00 level, followed by a 38.2% retracement to the 150.18 level. Breaking through these levels will provide buyers with greater confidence and pave the way for further gains, especially after successfully breaking through the 100 day moving average.
On the contrary, if these levels cannot be regained, the seller can control the situation. Although buyers have successfully defended key support areas, they have not yet decisively won broader battles. At present, the currency pair is in a tug of war, with key support levels at the 100 day moving average (148.95) and resistance levels at the retracement level of 150.18.
Sellers of AUD/USD are pushing in a downward direction

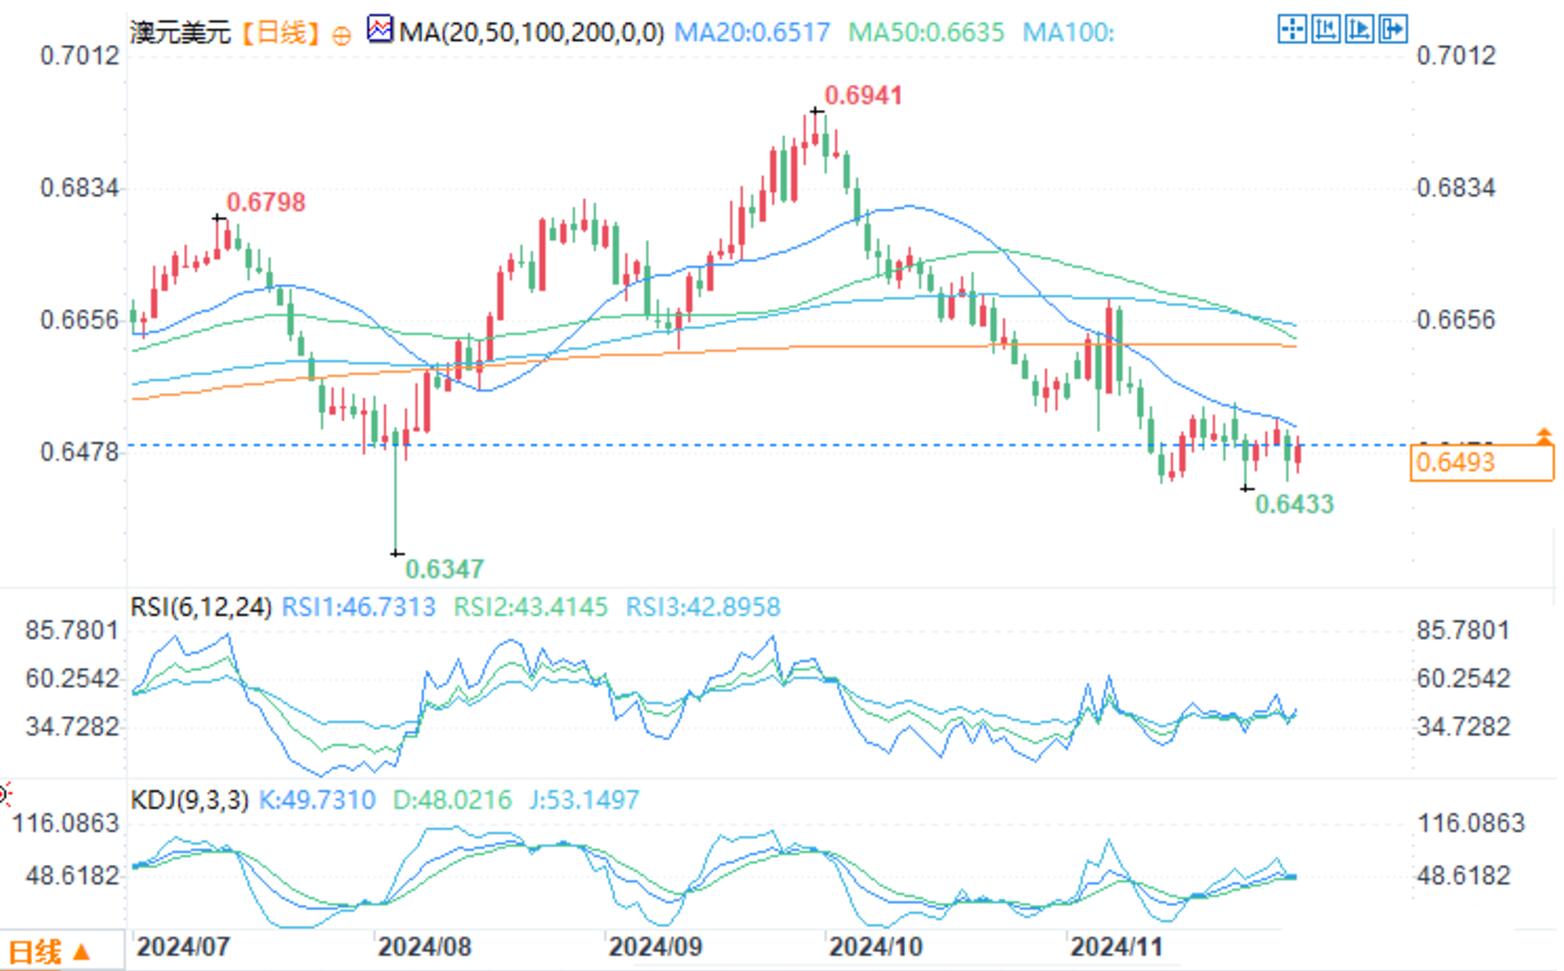
AUD/USD daily chart
The Australian dollar/US dollar fell yesterday, testing the key fluctuation range between 0.6433-0.6442. When the price reaches the upper boundary of the region, the selling pressure is relieved and buyers intervene, causing the currency pair to rebound to the close. This rebound pushed the price into a higher volatility range between 0.6471 and 0.64817, but the upward momentum stalled in that area.
In today's trading, the currency pair initially rose, but quickly reversed due to the support of a larger than expected current account deficit and a renewed strengthening of the US dollar, as sellers re entered the market. The decline has pushed the price away from the higher volatility zone and shifted the focus to the lower volatility zone between 0.6433 and 0.6442.
If it falls below this lower volatility zone, it may pave the way for testing the November low, with further downward targets at the April low of 0.6363 and the August low of 0.6347- the lowest levels of the year.
On the upside side, buyers will need to recoup 0.64817 to restore some confidence, but even so, more work is still needed to shift broader momentum away from sellers. At present, unless buyers can clear key resistance levels and maintain an upward trend, the bias remains bearish.
Support levels: 0.6383 (November low), 0.6363 (April low), 0.6347 (lowest price of the year, lowest price in August)
Resistance level: 0.64817 (buyers need to retract this level to regain confidence)
Buyers of NZD/USD are trying to hold onto support levels

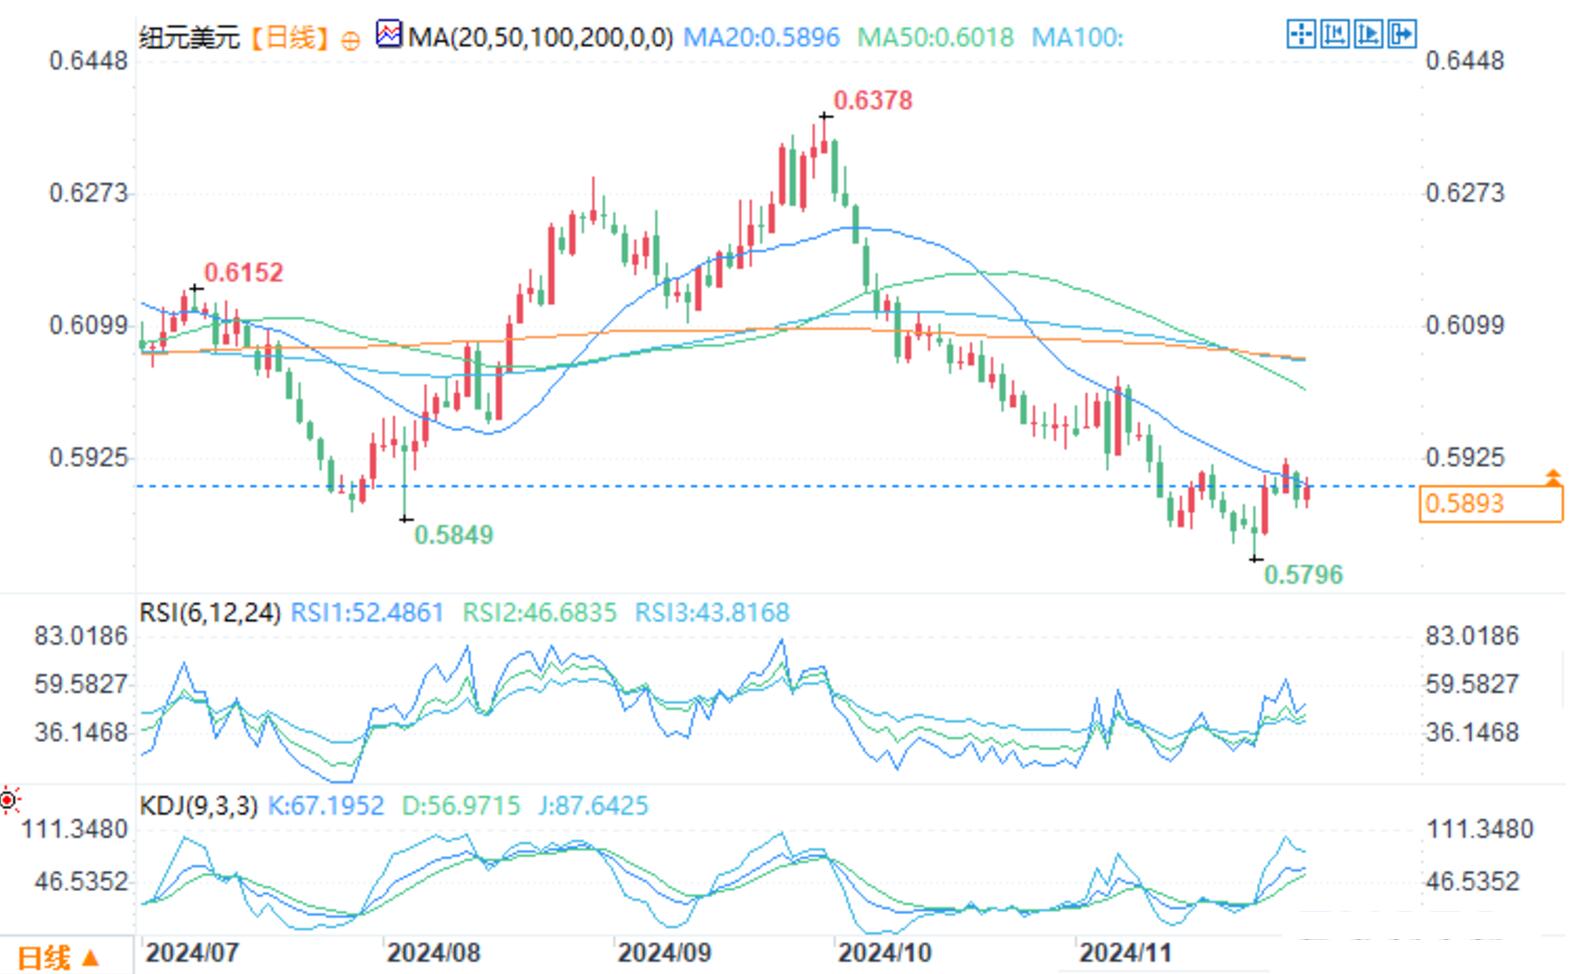
Daily chart of NZD/USD
Sellers of NZD/USD pushed the currency pair lower on Monday, but reached a swing zone near the daily charts of 0.5848 and 0.5859. The low point is around 0.5862, and the price rebounds and rises.
In today's trading, the price fell again and extended towards the fluctuation range of 0.0.5848 to 0.5859 for the second consecutive day. Buyers entered the market again and prevented the decline (at least so far).
The seller tested twice and fell below the support level, but neither was successful. In situations where risks are clear and limited, buyers tend to support, even though the seller controls the situation, the buyer is still 'involved'.
What do buyers need to do to gain more control?
Firstly, it is necessary to maintain above 0.5848, break through the 100 hour moving average 0.5886 on the 4-hour chart, break through the 38.2% fluctuation range 0.5889 in November, and break through the 100 hour moving average 0.58937.
If this can be achieved and the price remains above the region, buyers will begin to explore more upward correction space.
USD/CHF continues to fluctuate within the range near the high point

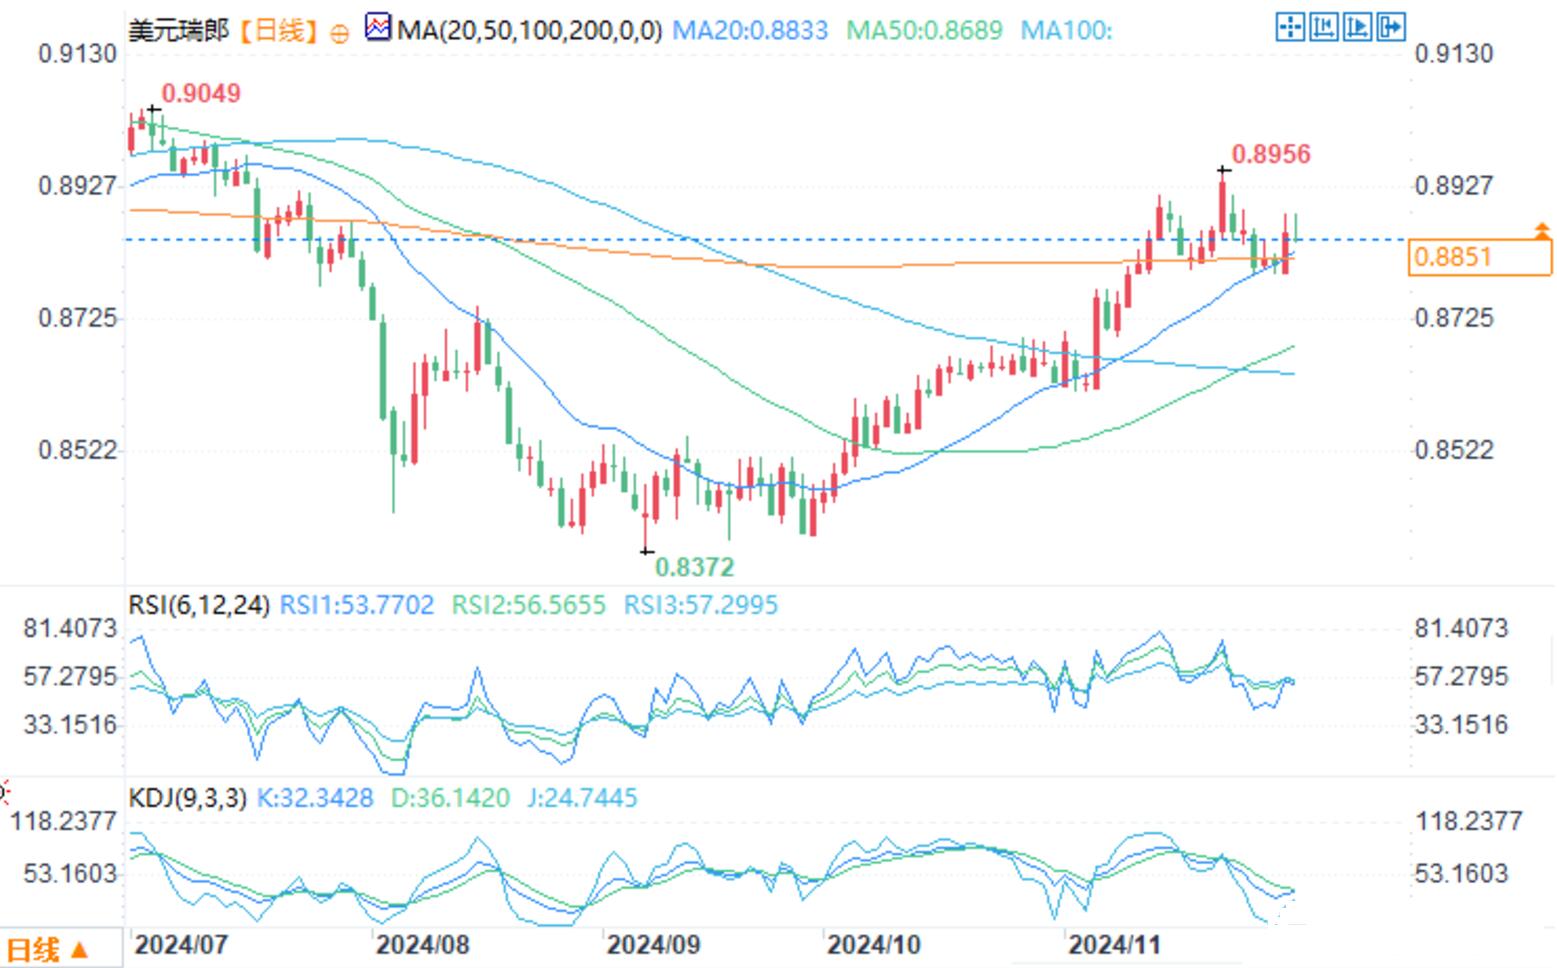
USD/CHF daily chart
In terms of the Swiss franc, the Swiss CPI met expectations today. The market continues to believe that there is a 72% chance of a 25 basis point rate cut in December, with a total rate cut of 70 basis points by the end of 2025.
On the daily chart, the US dollar/Swiss franc continues to fluctuate within a range near its high point. Within this time frame, there is an upward trend line to define the bullish trend. Buyers will have clear risks below the trend line, preparing for the next rebound to 0.9050. On the other hand, sellers hope to see prices fall below the trend line and start targeting new lows.
On the 4-hour chart, we can see that we have a good support area around 0.88, where prices have been rejected multiple times in the past few weeks. This increases the convergence point of the trend line, which should give buyers more confidence to enter near these levels. On the other hand, the seller will seek a lower breakthrough to gain control and aim to drop to 0.87.
Tips:This page came from Internet, which is not standing for FXCUE opinions of this website.
Statement:Contact us if the content violates the law or your rights
