Outlook for this week: Futures face key support of 2400, and will face dual tests of US GDP and PCE this week
The gold market ended again at a critical moment last week, testing the key support level of $2400 per ounce.
Last week, the gold price opened strong and successfully rose to a new high of over $2480 per ounce. However, as the market gave up all its gains, gold prices closed down for the first time in three weeks, and the upward momentum is expected to quickly dissipate.
August gold futures closed at $2402.80 last Friday, down 1.84% on the day and 0.5% from the previous week.
James Stanley, Senior Strategist at Forex, stated in an interview with Kitco News that this correction is reasonable as prices appear overbought. He added that $2500 is another key psychological level, and the risk reward situation is unbalanced.
At present, we need to see if $2400 can hold, but we don't have enough information. If it can hold, this will provide strong bullish reasons for gold, "he said. I still have a positive outlook on gold because its price trend is supported by strong fundamentals
Stanley stated that although $2400 is the recent bottom line, gold prices need to fall below the support level of $2300 per ounce to weaken the bullish sentiment in the market.
TD Securities' commodity analysts also believe that prices may fall in the short term due to investors taking profits after reaching a historic high.
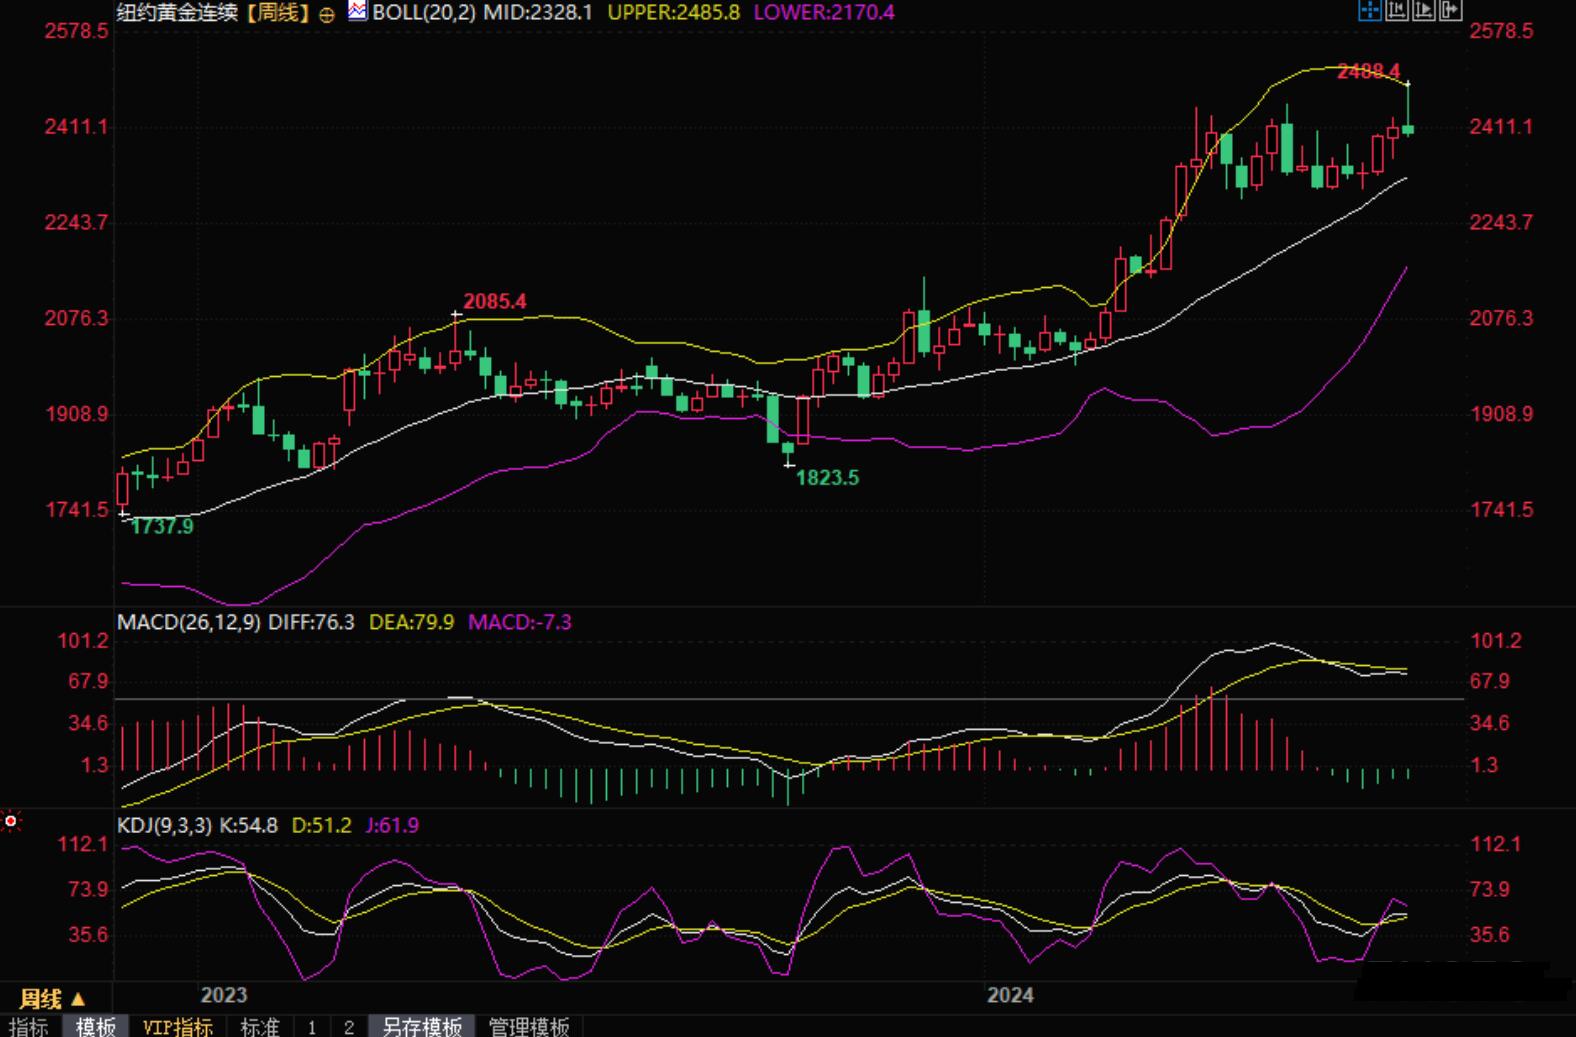
COMEX Gold Futures Main Contract Daily and Weekly Line Chart
In a report last Friday, analysts stated, "We reiterate that position risk is asymmetrically skewed downwards for the first time in months." "CTA may now sell in the next few trading days, even in the event of a significant increase. In fact, the rise in asset volatility is most likely to cause pain to trend tracking algorithms. Our analysis of capital flows suggests that the downward window for gold has opened, and the bull market for gold may be about to pause
Alex Kuptsikevich, Senior Market Analyst at FxPro, stated that the simultaneous pullback of gold and the US stock market does not indicate a good sign for precious metals.
The typical pattern of gold in recent months is a pullback after reaching a new high, with similar declines occurring in May, April, March, and December. After the high point, there is a pullback, which subsides within about two weeks, leading to price stability and a resurgence, "he said. However, the bull market will not last forever, and traders should pay attention to signs of a reversal in this bullish trend.
Kuptsikevich added, "The next week may determine the momentum of the next few months. If the decline exceeds 3% in the next week, it may repeat the patterns of 2020 and 2022, and experience a long-term adjustment of more than six months. The most worrying thing is the replay of the 2011 pattern, when gold prices fell by 20% in four weeks after reaching a high of $1921. This peak was not rewritten until nine years later, from the global peak to the global trough, and the value of gold per ounce almost halved, falling for more than four years.
In addition to the technical outlook for gold, investors will also focus on basic economic data as key inflation data will be released in the coming week.
Analysts point out that gold currently has a strong correlation with interest rate expectations, and the rise of gold to a historical high coincides with the expectation that the Federal Reserve will launch a loose cycle in September.
According to the Chicago Mercantile Exchange's Federal Reserve Watch tool, the market expects a probability of over 90% for a rate cut by the end of summer.
Stanley stated that the only factor that could disrupt the upward trend of gold is rising inflation, which would lead investors to question possible interest rate cuts. Although this situation is unlikely to happen, he said there are still risks involved.
Thorsten Polleit, Honorary Professor of Economics at Bayreuth University and publisher of the BOOM&BUST report, recently stated in an interview with Kitco News that he expects inflationary pressures to continue easing due to the decline in money supply, providing room for the Federal Reserve to cut interest rates.
Investors will have to wait until Friday to see the core personal consumption expenditure index for June. Last month, the Federal Reserve's preferred inflation indicator showed a 2.6% increase in inflation rate.
In addition to key inflation data, the market will first focus on the second quarter's gross domestic product.
In terms of central bank activities, the Bank of Canada will announce its monetary policy decision on Wednesday. Economists believe that weaker inflation data provides room for the central bank to cut interest rates.
This week's noteworthy economic data
Monday: China's July five-year loan market quoted interest rate
Tuesday: Annual Total of Existing Home Sales in the United States for June
Wednesday: Bank of Canada monetary policy decision, initial US July SPGI manufacturing PMI, US June seasonally adjusted new home sales annualized total (in 10000 households)
Thursday: Initial annualized quarterly rate of real GDP for the second quarter of the United States (%), initial jobless claims for the week ending July 20th in the United States (10000), initial monthly rate of durable goods orders for June in the United States (%)
Friday: June Personal Expenditure Monthly Rate and June PCE Price Index Annual Rate (%) in the United States
Tips:This page came from Internet, which is not standing for FXCUE opinions of this website.
Statement:Contact us if the content violates the law or your rights