Mid week bearish trend with consolidation, gold and silver short bullish range (12.9)
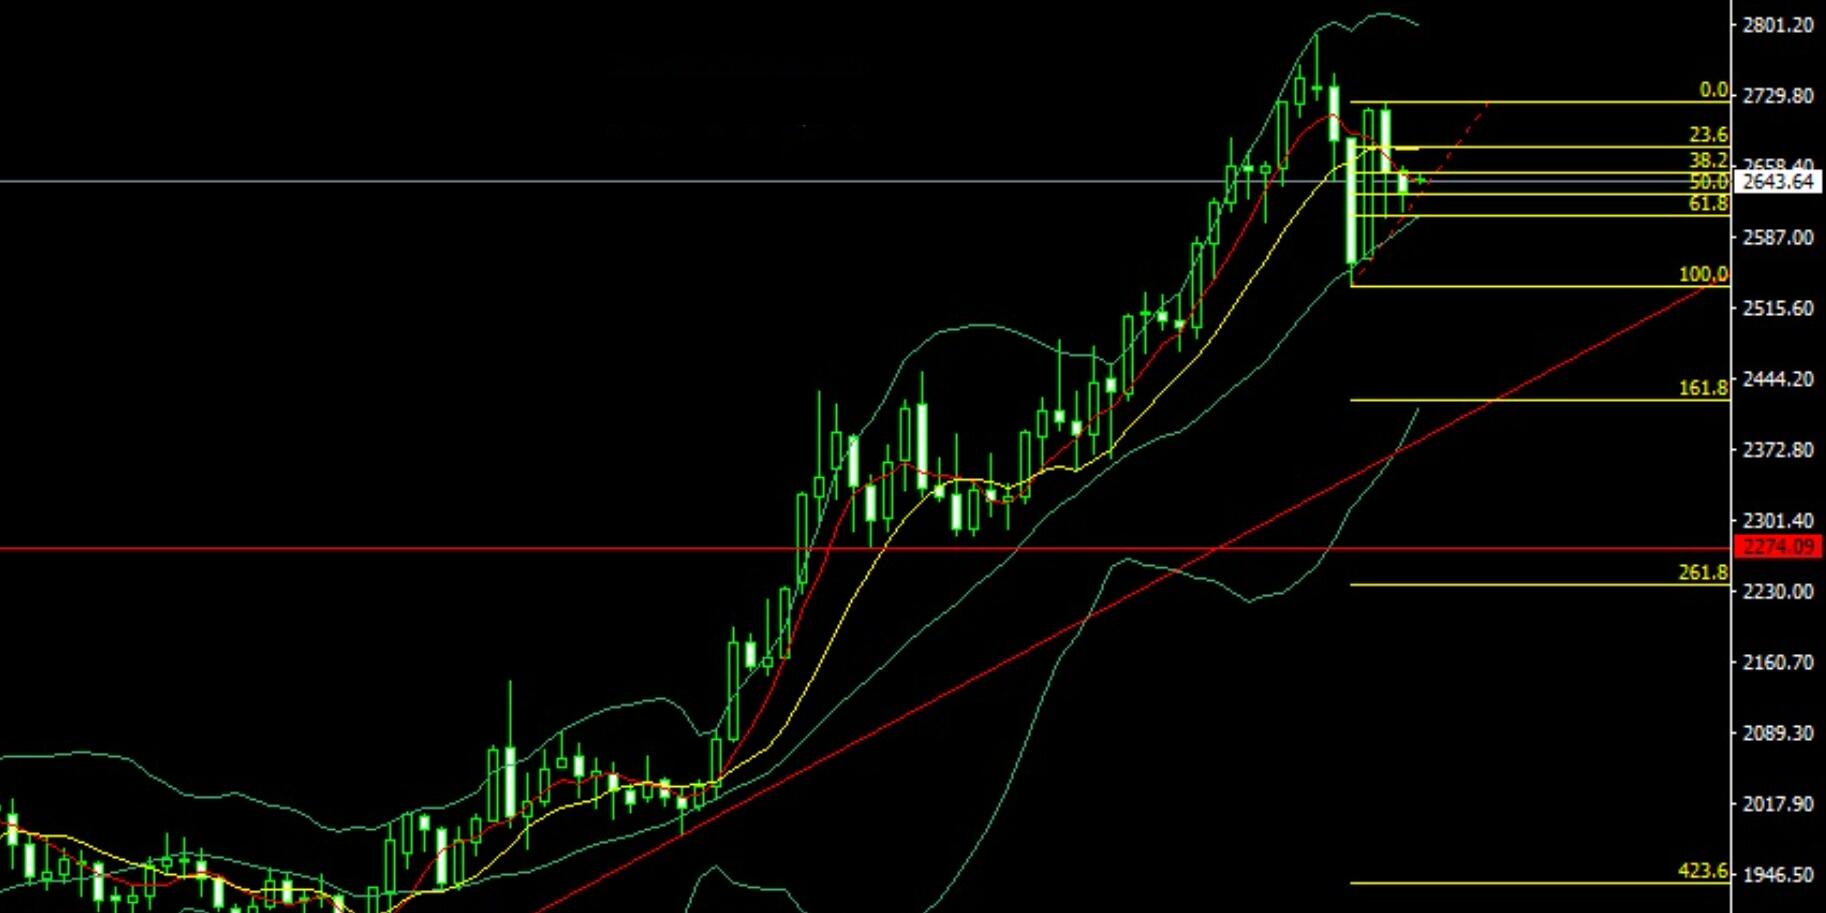
Last week, the gold market opened at 2652.7 at the beginning of the week and then fell directly. After reaching 2621, the market rose. The weekly line reached its highest point at 2657 and then fell. On Friday, the weekly line reached its lowest point at 2613 and then rose at the end of the day. The weekly line finally closed at 2632.6 and ended with a long bearish candlestick. After this pattern, the market opened high this week and then fell more. At 2625 today, the market stopped at 2620, and the target is to see pressure from 2645, 2652, and 2657.

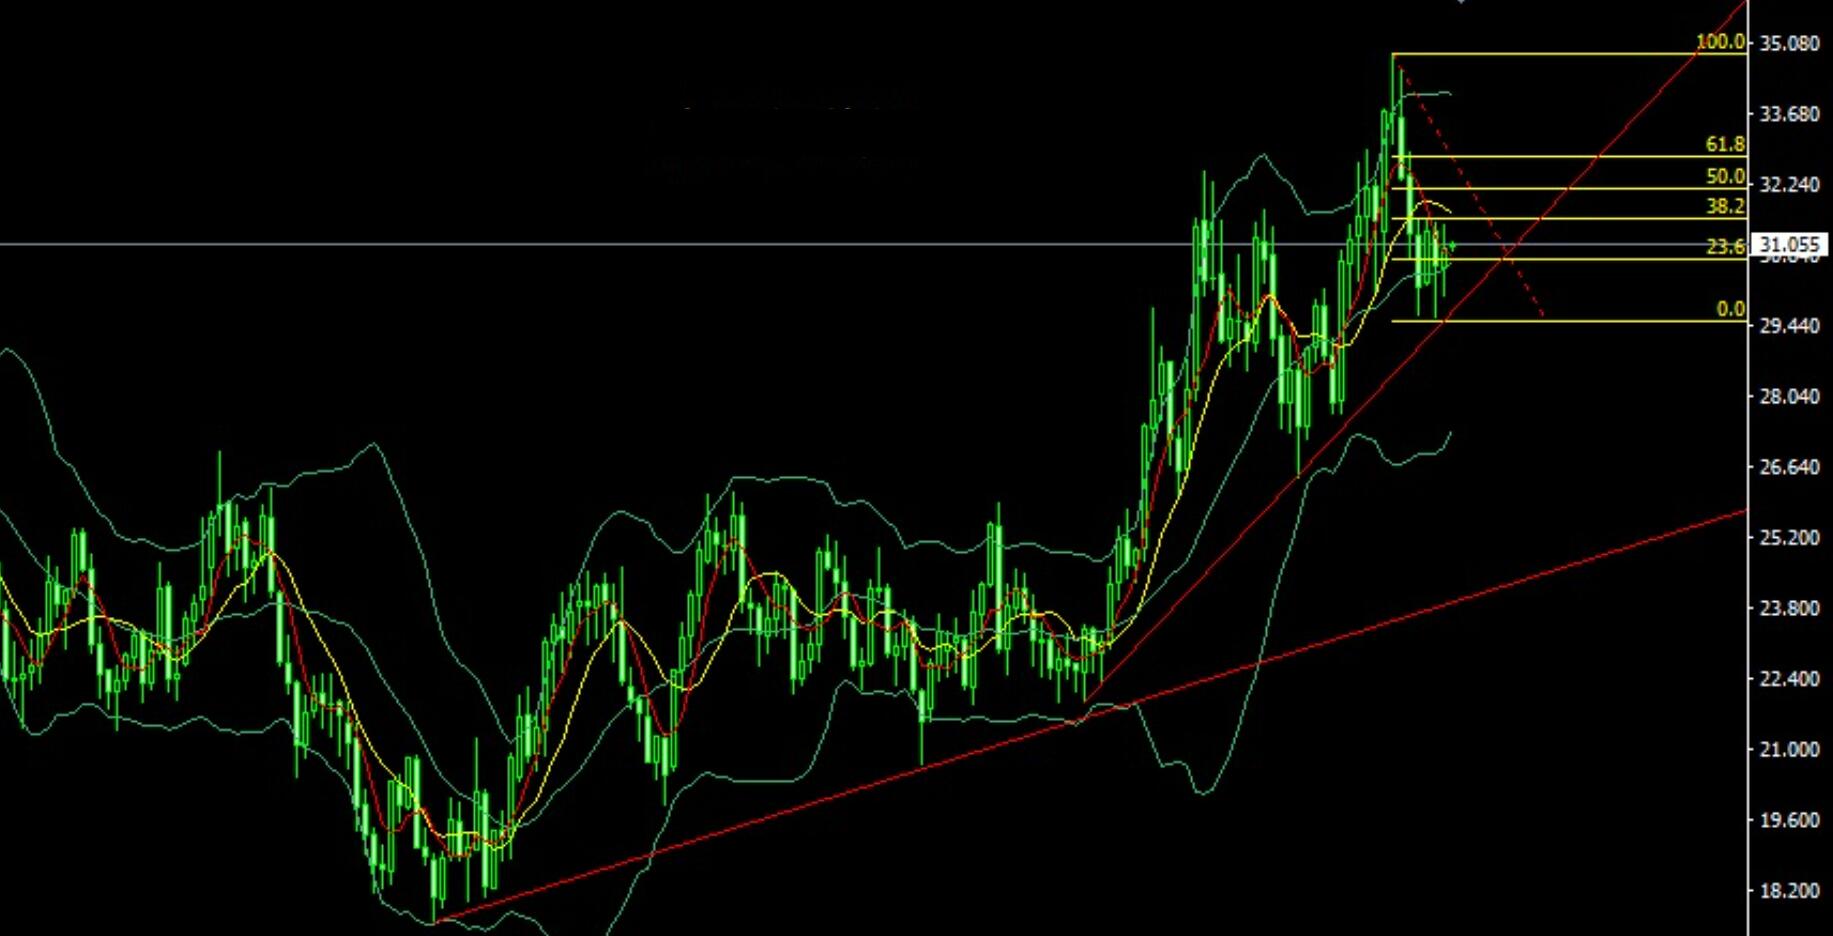
The silver market fluctuated in the range last week. At the beginning of the week, it opened at 30.586 and then fell back. The weekly low was at 30.028 before the market rose, and the weekly high reached 31.47 before the market consolidated. The final closing line of the weekly line was at 30.941, and the market ended in a spindle shape with a slightly longer lower shadow than the upper shadow. After this pattern ended, today's buy long stop loss of 30.4, the target is at 31.3 and 31.5, and the break level is at 31.7 and 32 pressure.

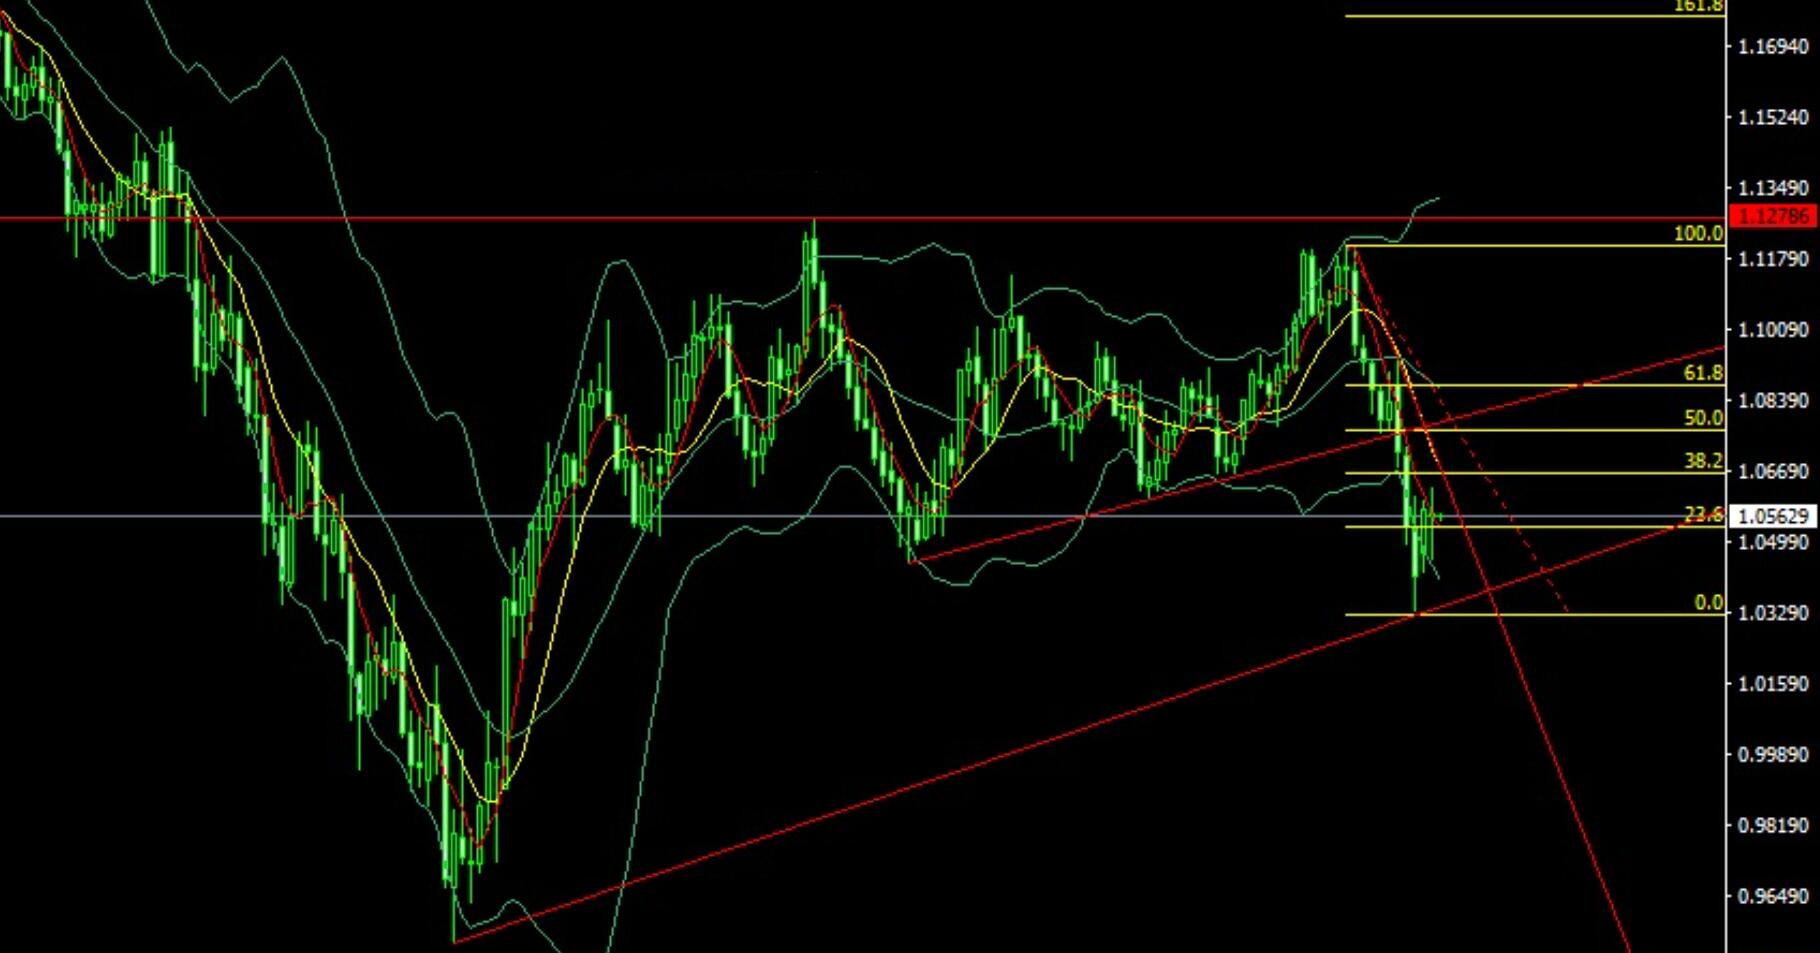
The EUR/USD market opened low at 1.05588 last week and then fell back, reaching a weekly low of 1.04950 before a strong rally. The weekly high reached 1.06287 before falling back in the late trading session. The final closing line of the week was at 1.05677, and the market closed in a star shaped pattern with a lower shadow line longer than the upper shadow line. After this pattern ended, the market returned to the long position this week. At the point level, if it falls back today, a buy long stop loss of 1.04900 is given at 1.05100, with targets at 1.05700, 1.06000, and 1.06200

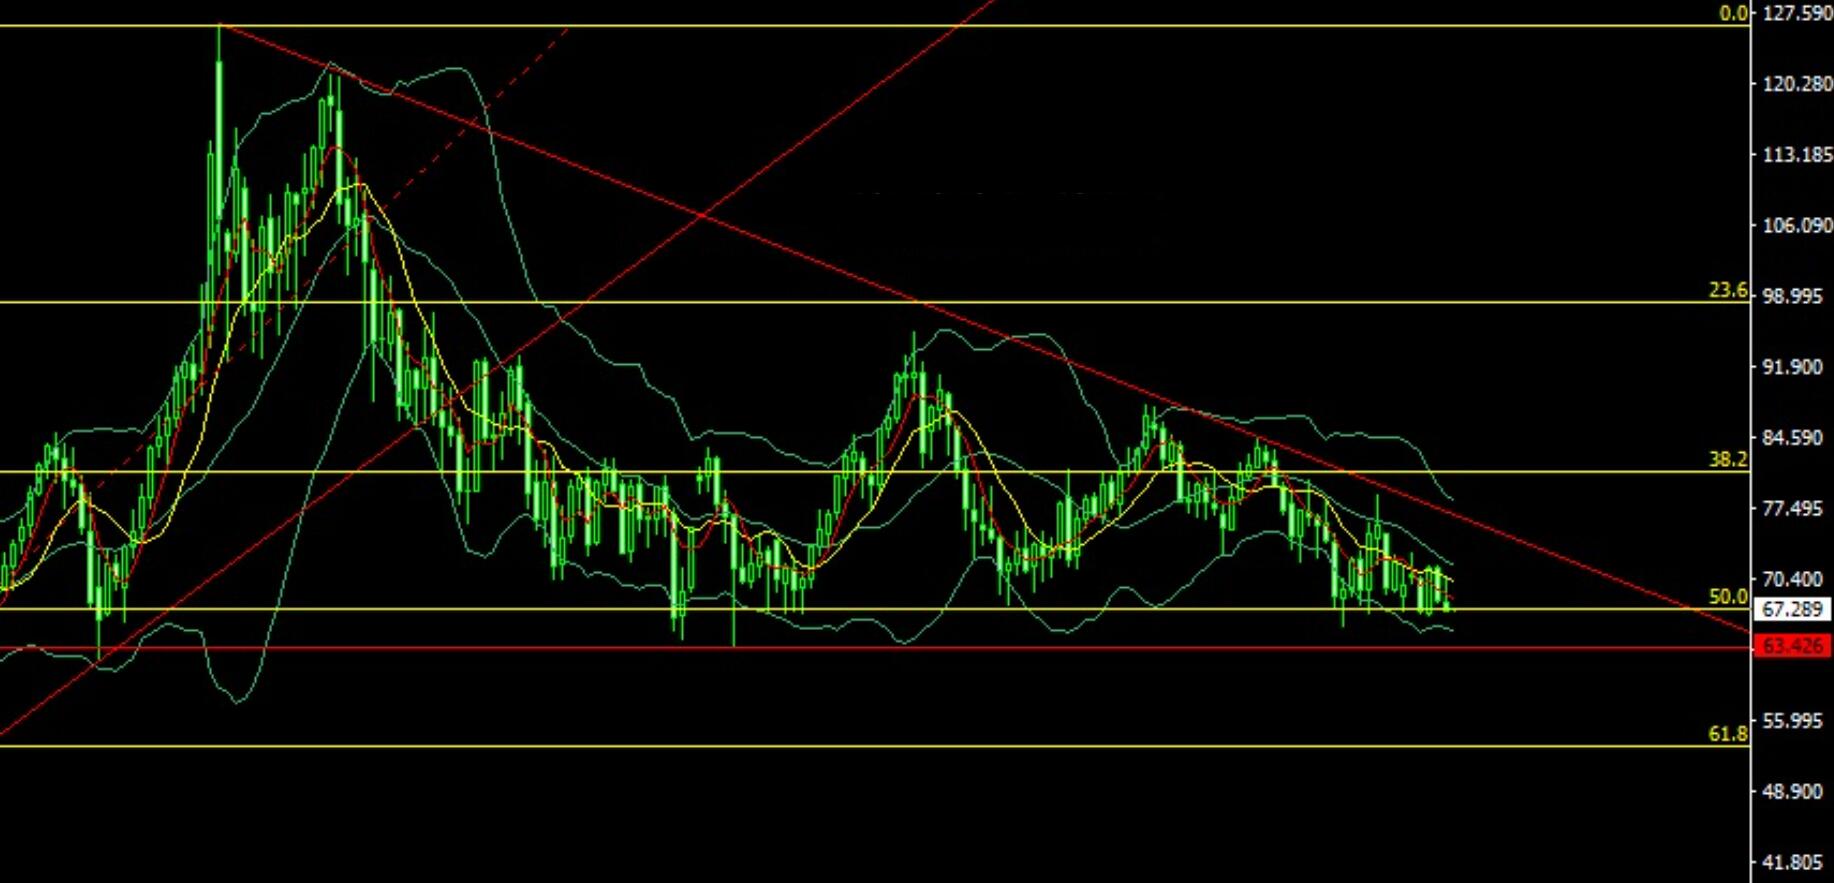
The US crude oil market opened at 68.05 last week and then rose first. The weekly high reached 70.57 before the market surged and fell back. The weekly low was 67 before the market stabilized. The final closing line of the weekly line was at 67.16, and it closed in a long inverted hammer shape with an upper shadow. After this pattern ended, there was still technical pressure on the weekly line. At 68.15 today, the short selling stop loss was 68.6, and the lower targets are at 67 and 66.7

Tips:This page came from Internet, which is not standing for FXCUE opinions of this website.
Statement:Contact us if the content violates the law or your rights
