Gold prices continue to be in a long short tug of war, with attention paid to US CPI data this week
On Monday (December 9th), gold prices fluctuated slightly and rose, with spot gold touching $2650.42 per ounce at one point. Concerns about the geopolitical situation in Syria provided some safe haven support for gold prices. However, investors noted the possibility of a ceasefire between Russia and Ukraine, as well as the possibility of ceasefire negotiations between Israel and Hamas, limiting the rise of gold prices. Currently, trading is at $2638.17 per ounce. Investors are still waiting for the release of US inflation data this week to further understand the growing wait-and-see sentiment in the Federal Reserve's monetary policy market.
Fundamentals
Recent major benefits: 1. The volatile situation in Syria has boosted demand for safe haven purchases. 2. The non farm payroll unemployment rate in the United States has risen, and multiple Federal Reserve officials have spoken in a dovish tone, raising expectations for a Fed rate cut in December. US bond yields have fallen, supporting gold prices. 3. China has increased its holdings of gold after a six-month hiatus.
Recent major bearish factors: 1. Israel and Hamas are pushing for a ceasefire agreement. 2. Trump calls for an immediate ceasefire between Russia and Ukraine. 3. The US dollar index rebounded from its low in the past four weeks.
Market Focus: US November CPI Data, Geopolitical Situation
Medium - to long-term benefits: the interest rate cutting cycle of global central banks, the uncertainty of Trump's policy prospects, and global geopolitical instability.
Technical aspect
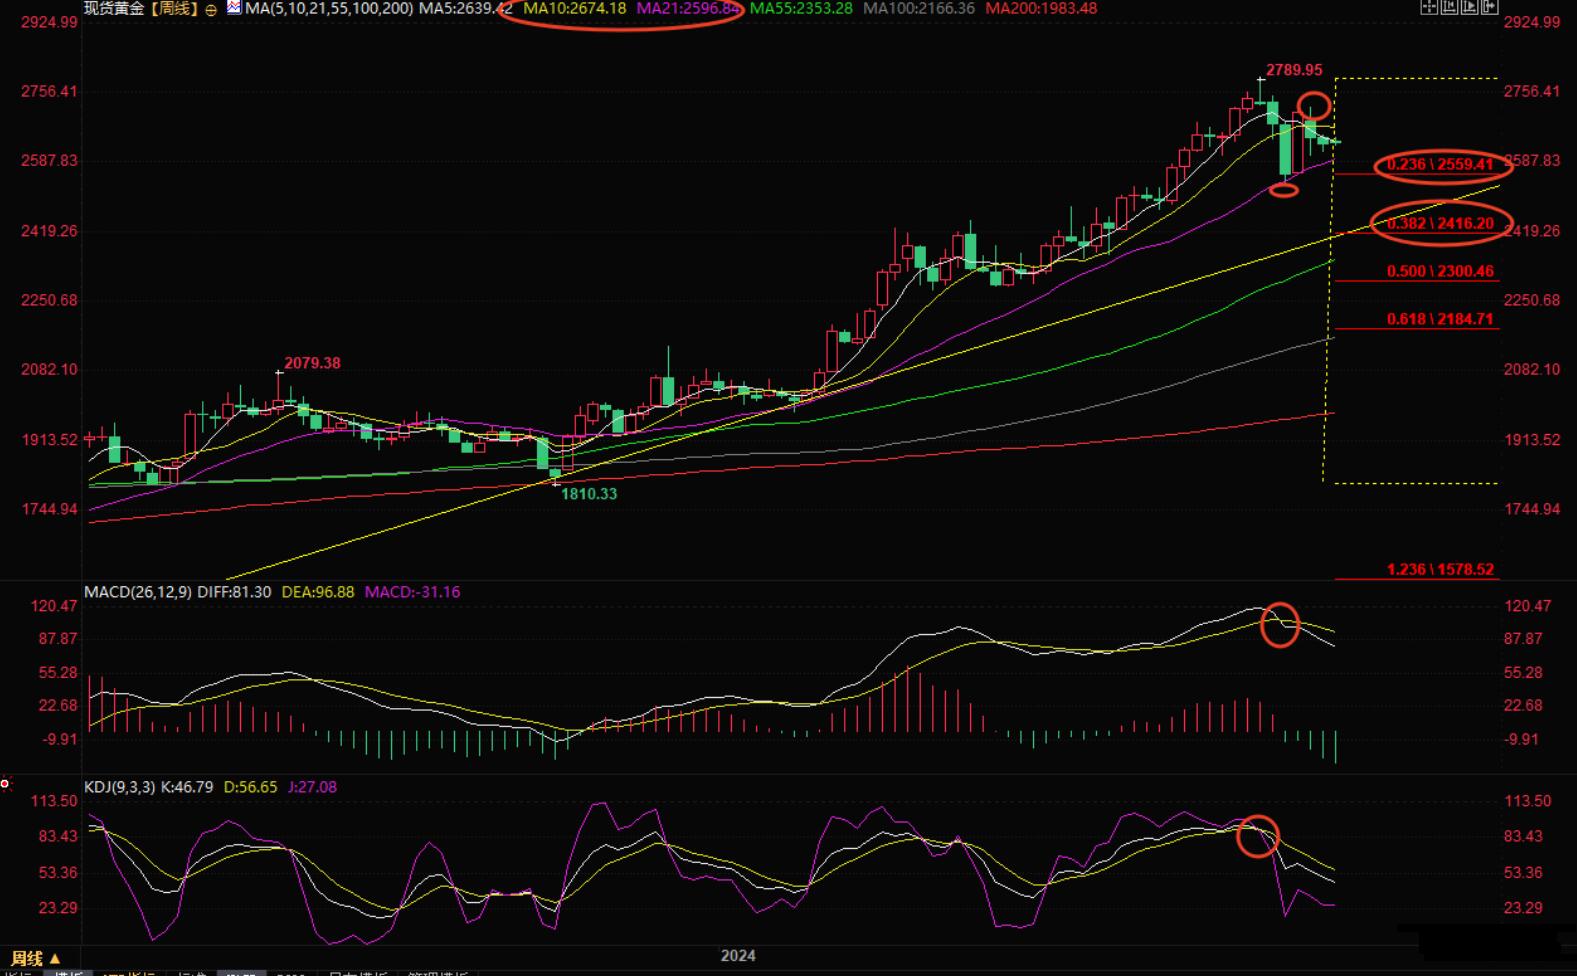
Weekly level: After a unilateral rise, there is a volatile pullback, with MACD and KDJ running at a dead cross. Before breaking through the 10 week moving average of 2675.66, the market is slightly inclined to continue the pullback trend. The 21 week moving average supports around 2596.87, the 23.6% retracement level supports around 2559.41, and the November low support is around 2535.68. If it falls below this level, it may look towards the dual support of the 38.2% retracement level and the uptrend line around 2416.20.
If the gold price breaks through the resistance of the 10 week moving average, it will weaken the bearish signal in the future. The resistance of the high point in the past four weeks is around 2721.21. If it recovers from this position, it will increase the bullish signal in the future.

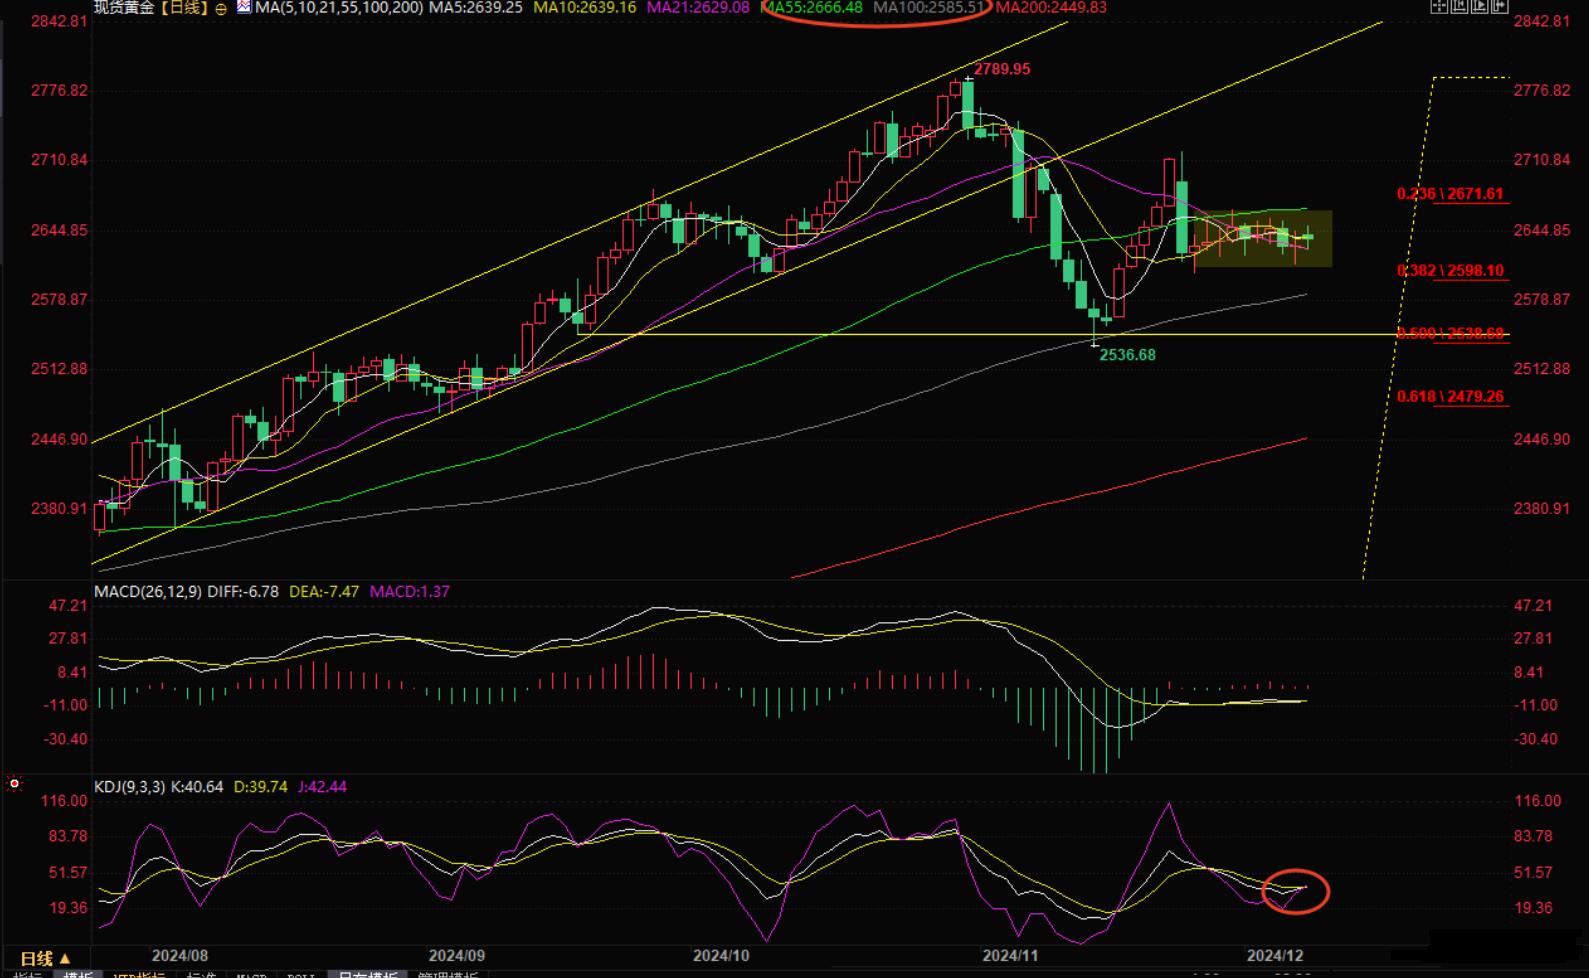
Daily level: oscillation; The gold price has been fluctuating in the 2605-2666 area for the past two weeks, with MACD sticking together and moving averages interweaving. The future trend lacks a clear direction, and KDJ has a golden cross trend. Pay attention to the double resistance level near the high point of the past two weeks and the 55 day moving average of 2666.49. If it breaks through this level, it is expected to open a new upward channel.
Given that the bearish candlestick on November 25th is still suppressing bullish morale, if the gold price falls below the support near the November 26th low of 2605.13, it will increase the bearish signal for the future; Of course, there is still some support around the 100 day moving average of 2585.50.

Resistance: 2650.00; 2657.00; 2666.49; 2675.66;
Support: 2627.70; 2620.86; 2613.55; 2605.13; 2596.87;
Conclusion: Technical signals tend to be volatile, with mixed long and short news on fundamentals. The latest changes have triggered a slightly bullish sentiment, so be aware of the possibility of volatile upward movements; But before the US CPI data, the gold price still tends to maintain a volatile operation, waiting for a breakthrough.
Tips:This page came from Internet, which is not standing for FXCUE opinions of this website.
Statement:Contact us if the content violates the law or your rights
