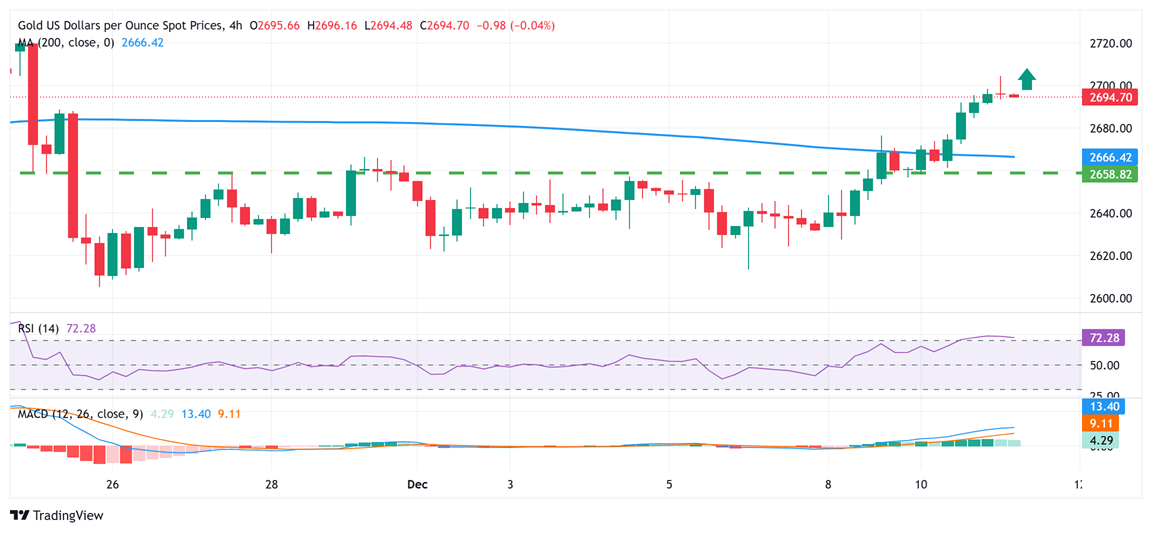
What happened? Gold suddenly experiences a sharp pullback, plummeting nearly $30
On Wednesday (December 11th), at the end of the Asian market, spot gold suddenly fell sharply, with a low of $2674.69 per ounce, a drop of nearly $30 from the earlier intraday high. Analyst Haresh Menghani's latest article on Wednesday analyzed the technical trend of gold prices.
Menghani wrote that gold prices have fallen from a two-week high, and bulls have become cautious ahead of the release of the US CPI report. Less dovish bets on the Federal Reserve and rising US bond yields supported the US dollar and depressed gold prices.
However, Menghani pointed out that geopolitical risks, trade war concerns, and interest rate cut bets should help limit the decline in gold prices.
At 21:30 Beijing time on Wednesday, the November Consumer Price Index (CPI) report for the United States will be released, which may affect the interest rate path of the Federal Reserve at its meeting on December 17-18.
Economists surveyed by Dow Jones expect the US CPI to increase by 0.3% month on month and 2.7% year-on-year in November. Last month, the data increased by 0.2% month on month and 2.6% year-on-year.
The core CPI in the United States, excluding volatile food and energy prices, is expected to increase by 0.3% month on month in November, unchanged from October. The year-on-year growth rate of the US core CPI in November is expected to remain at 3.3%.
Analysts point out that the expected CPI data is unlikely to hinder interest rate cuts, but if the data shows stagnant inflation progress, the possibility of the Federal Reserve cutting interest rates for the third consecutive time may decrease.
According to the Chicago Mercantile Exchange Group's "Federal Reserve Watch Tool," the market currently expects a probability of over 85% that the Fed will cut interest rates by 25 basis points at its December policy meeting.
Menghani stated that the crucial US CPI report will provide guidance for Federal Reserve decision-makers next week, which in turn will impact the US dollar and provide new impetus for gold.
How to trade gold?
Menghani pointed out that from a technical perspective, the breakthrough of gold prices in the $2650-2655/ounce range this week and the subsequent upward trend are favorable for bullish traders. In addition, the oscillation indicators on the daily chart have been gaining positive traction and are still far from the overbought area. This in turn confirms the positive outlook for gold prices in the near future and supports the prospect of some bargain buying near the aforementioned regions.
Menghani said that this should help limit the downward space of gold prices around the $2630/ounce area; Once it falls below this region, the downward trajectory of gold prices may further extend towards the integer level of $2600 per ounce.

On the other hand, Menghani added that if the gold price continues to break through $2700 per ounce, it may further extend towards the $2720-2722 per ounce barrier. Subsequently, the resistance level is around the $2735/ounce area. If this resistance level is overcome, it will indicate that the recent corrective decline from the historical high reached in October has ended and shift the trend towards bullish traders.
This momentum may push gold prices up to the 2758-2760 USD/oz barrier, and then move towards the 2770-2772 USD/oz and 2790 USD/oz regions (record highs).
Tips:This page came from Internet, which is not standing for FXCUE opinions of this website.
Statement:Contact us if the content violates the law or your rights
