Gold prices show signs of bottoming out, with resistance in the $2417-2418 range!
Market analyst Haresh Menghani said that gold has been continuously declining since hitting a historical high last week, but recently it seems to have attracted some buyers and stopped the obvious decline. Against the backdrop of dovish expectations from the Federal Reserve, US President Biden's withdrawal from the presidential race has prompted some investors to unwind some trades betting on Trump's victory. This in turn puts dollar bulls on the defensive and provides some support for gold prices.
In addition, concerns about slowing economic growth in some Asian countries, as well as geopolitical risks posed by ongoing conflicts between Russia, Ukraine, and the Middle East, have further benefited safe haven gold prices. However, there is a lack of follow-up buying for gold prices, and traders are waiting for the release of the US Personal Consumption Expenditure (PCE) price index data on Friday to find clues about the Federal Reserve's policy path, which will determine the recent trend of gold.
Menghani pointed out that from a technical perspective, any subsequent increase in gold prices may encounter some resistance near the $2417-2418 range. Above this region, a round of short covering may push gold prices up to the $2437-2438 range. Breaking through the sustained strength of the latter will be seen as a new spark for bullish traders and laying the foundation for challenging the historical high near $2482 hit on July 17th, but gold prices will first face some resistance around $2458.
From a downward perspective, if the gold price falls below the support level of $2390-2385, it may pave the way for further decline and drag the price to the Fibonacci level of 61.8%, which is around the $2366-2365 area. If it falls below, it will further fall towards the $2352-2350 area. Some subsequent selling will expose the Fibonacci level of 78.6%, which is around $2334-2334, and if it falls below it again, it will further drop towards the $2300 mark.
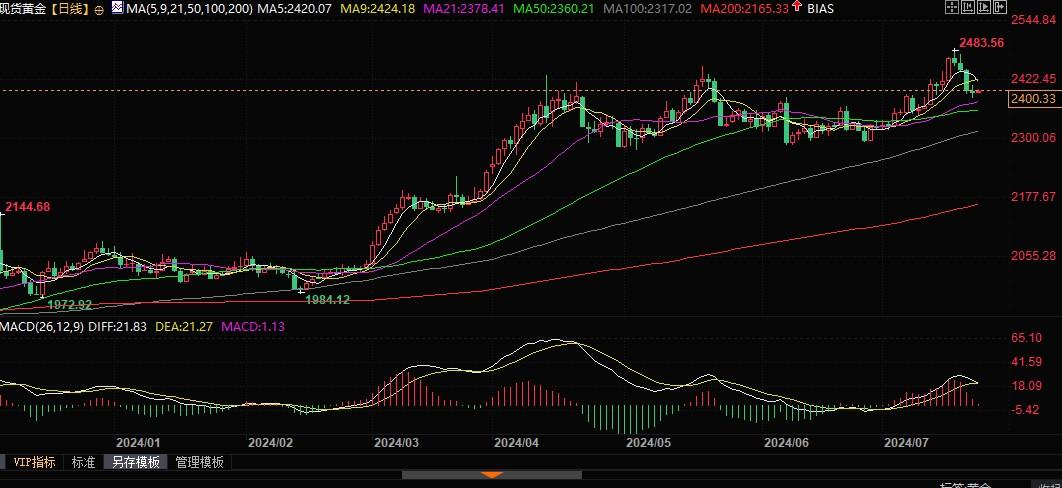
Daily chart of spot gold
Tips:This page came from Internet, which is not standing for FXCUE opinions of this website.
Statement:Contact us if the content violates the law or your rights