Gold prices close to 100 day moving average, with New Year's holiday approaching this week. Pay attention to PMI data
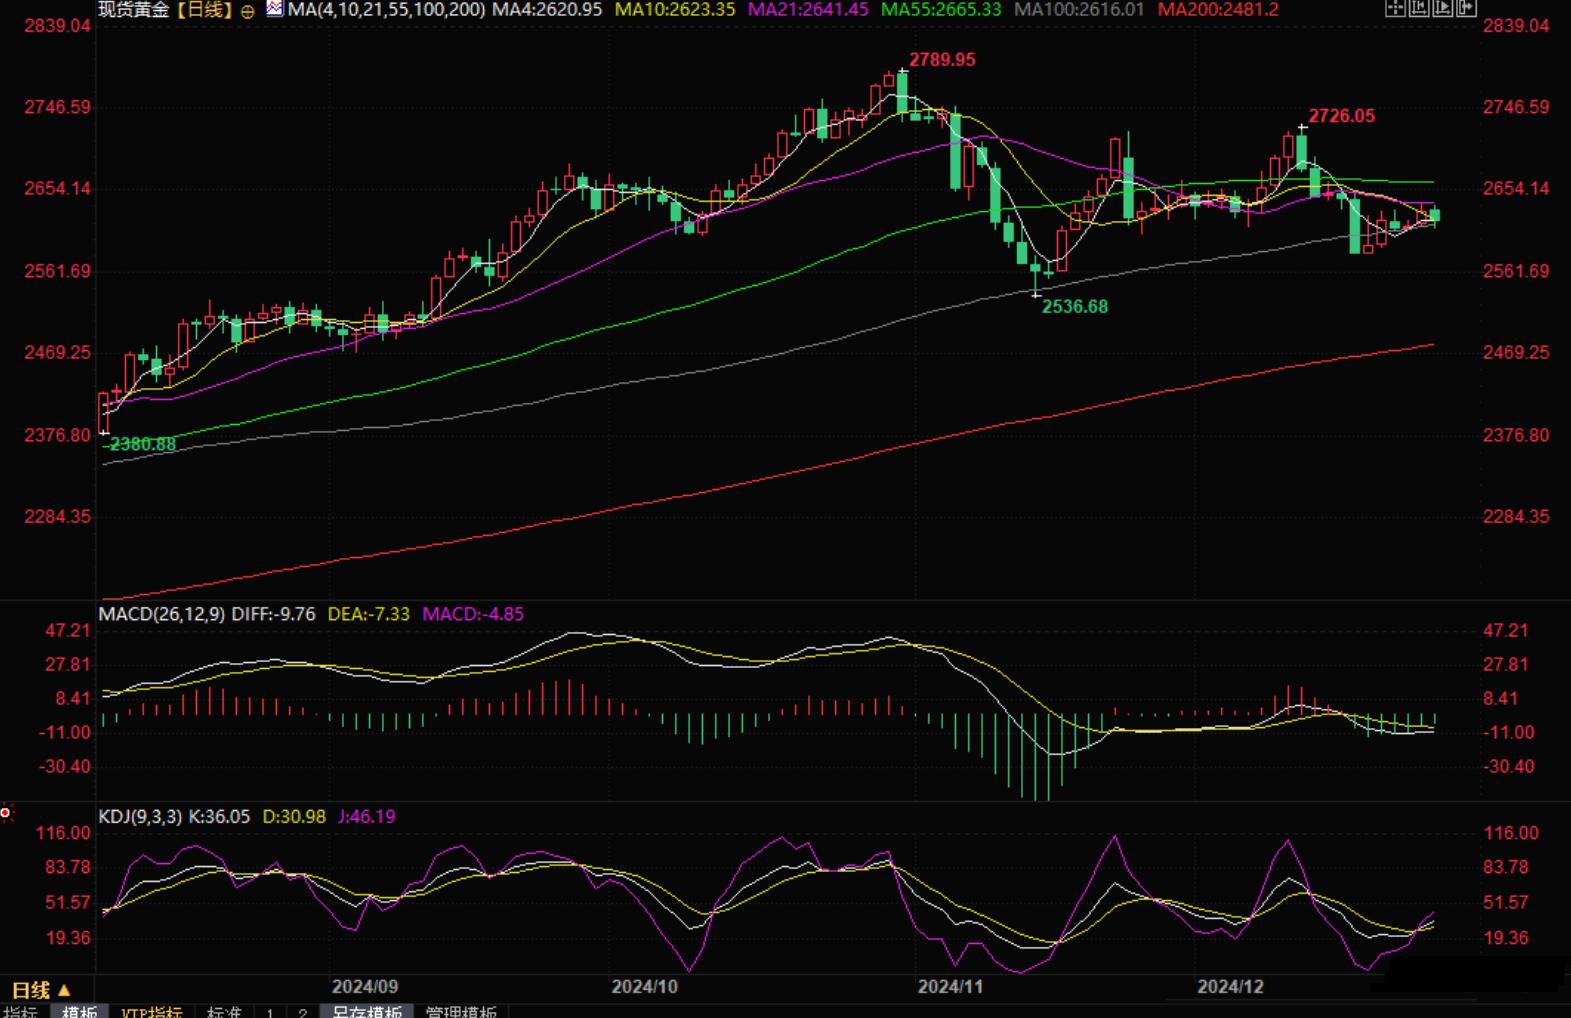
Spot gold closed last Friday (December 30) down 0.48% to close at 2620.96 US dollars/ounce, barely above the 100 day moving average of 2616.01. As the yield of US treasury bond bonds rose, the appeal of non yield gold was weakened in the scarce trading during the holiday. The market focused on the return of President elect Trump and the potential impact of his inflation stimulus policies on the prospects of the Federal Reserve in 2025.
Bob Haberkorn, senior market strategist of RJO Futures, said: "The yield of treasury bond bonds is slightly higher now, and gold will remain under pressure in the short term... The market is light during the holiday."
The yield of US 10-year treasury bond bonds rose sharply last Friday, and the stock market sold off. Trading was quiet last week. The trading time was shortened due to the holiday. Investors waited for this week's unemployment benefit data to find signs of economic trends in the new year.
The data released by the US Bureau of Statistics last Friday showed that retail inventory increased by 0.3% from $825.4 billion in the previous month to $827.5 billion in November. Wholesale inventory decreased by 0.2% from $903.8 billion in October to $901.6 billion. The yield of treasury bond did not change much after the release of enterprise inventory data.
Jack McIntyre, global fixed income portfolio manager of asset management company Brandywine Global Investment Management, said that another factor in treasury bond trading on Friday was the sell-off in the US stock market.
The Dow Jones Industrial Average closed down 0.74% last Friday, while the S&P 500 index fell 1.08% last Friday.
This represents a potential wealth transfer effect, "McIntyre said. "This may change people's economic prospects. A more pessimistic economic outlook may in turn affect people's appetite for treasury bond“
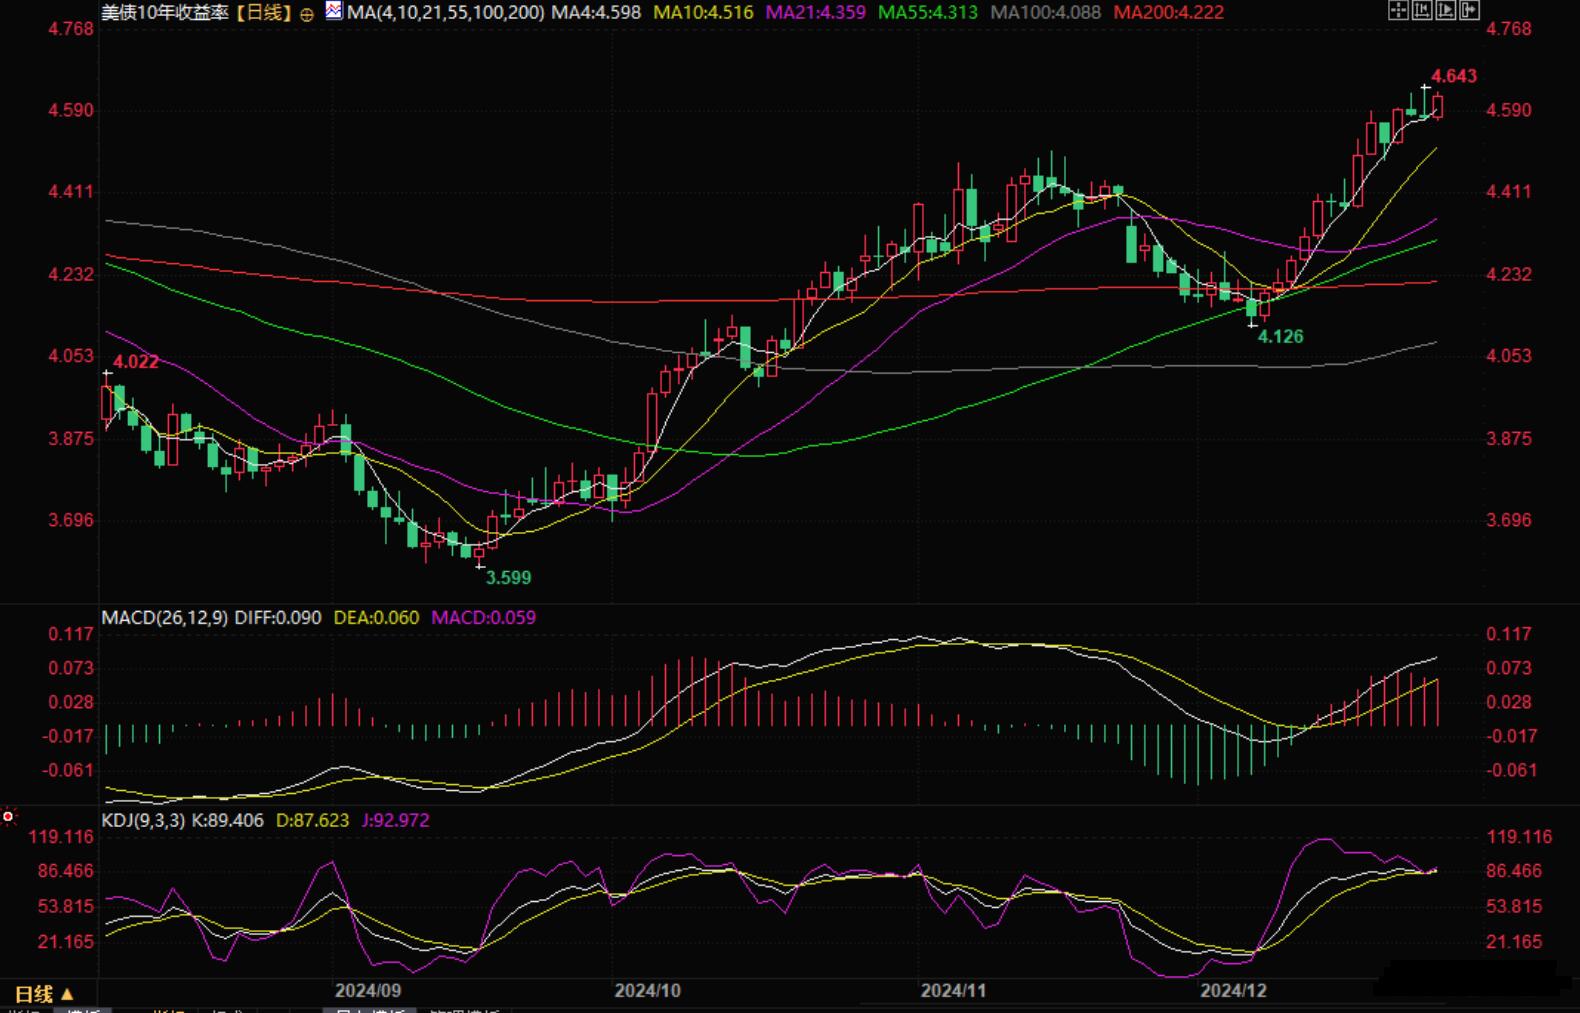
The yield of the US 10-year treasury bond bond rose 1.2 basis points to 4.596% on Friday from the end of the day on Thursday. The yield hit 4.641% last Thursday, the highest level since May 2, and fell after the strong seven-year treasury bond bond auction that afternoon.

Daily Chart of US 10-year treasury bond Bond Yield
According to the term structure of federal funds rate futures, traders believe that the possibility of the Federal Reserve relaxing policy at its January meeting is minimal. Earlier this month, the Fed made its third interest rate cut since shifting to a loose stance in September.
According to data from the London Stock Exchange Group (LSEG), traders believe that there will be no further interest rate cuts before May, and the likelihood of a second 25 basis point rate cut before the end of next year is less than 50%.
This week will usher in the New Year holiday, and market trading may be relatively light. The data to be released includes the November sales data of completed homes on December 30th and the S&P Case Shiller housing price index on December 31st. The latest initial unemployment benefit data will be released on January 2nd after the New Year holiday. In addition, European and American countries will release the final value of SPGI manufacturing PMI, and China's official manufacturing PMI data for December will be released on Tuesday. Investors need to pay attention.
Although the US dollar index fell slightly by 0.06% to close at 108.02 last Friday, the weekly chart still rose for the fourth consecutive week, which also reduced the attractiveness of gold to holders of other currencies. On December 20th, the US dollar index reached a two-year high of 108.54 and is expected to rise by 6.6% for the whole year.
So far this year, gold has surged 28%, reaching a historic high of $2790.15 on October 31st. The Federal Reserve's interest rate cut cycle and the intensification of global tensions have driven this upward trend.
Although the Federal Reserve currently expects a decrease in the number of interest rate cuts, most analysts still have a positive outlook on the trend of gold in 2025.
They believe that geopolitical tensions around the world will continue to escalate, and central banks will continue to aggressively purchase gold. With Trump's return to the White House in January, political uncertainty will linger.
The tariffs and trade protectionism policies he proposed are expected to trigger a potential trade war, thereby increasing the attractiveness of gold as a safe haven asset.
This week, the gold price is focused on the 2600-2641.45 range, which is the 21 day moving average. Breakthroughs in this range are expected to provide guidance for further market trends.

Daily chart of spot gold
Tips:This page came from Internet, which is not standing for FXCUE opinions of this website.
Statement:Contact us if the content violates the law or your rights
