Forex Trading Analysis: GBP/USD Under Pressure, USD/CAD Strong Upward
On Monday (January 20th) during the European trading session, the US dollar index fell slightly, closing at 109.1487/1390, a decrease of 0.23%. GBP/USD and USD/CAD remain stable. GBP/USD opens a new round of decline below the 1.2320 range. The US dollar/Canadian dollar is rising and may aim to break through the resistance level of 1.4500 and further rise.
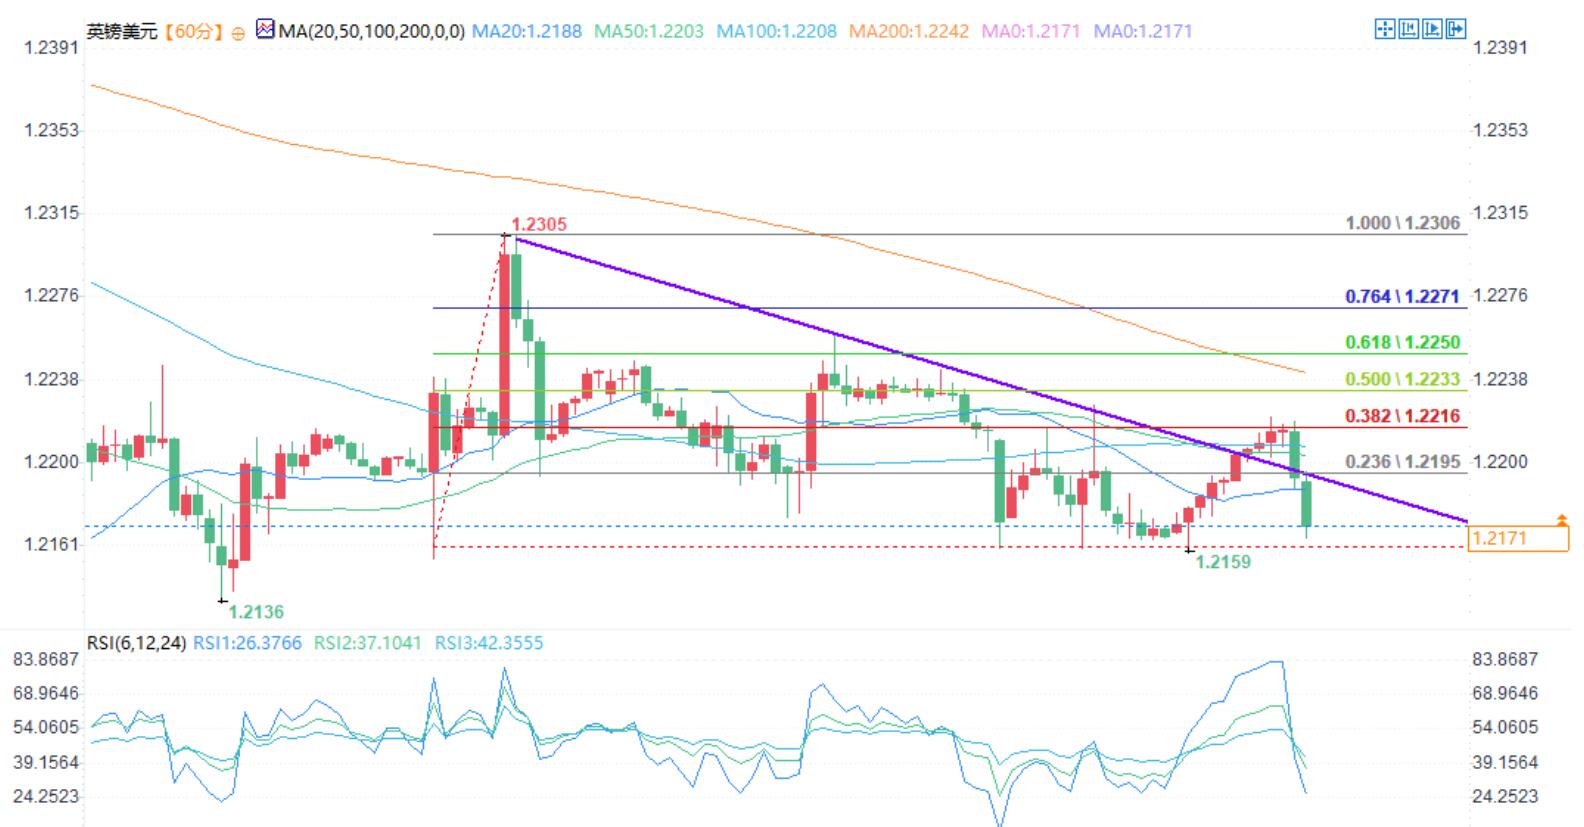
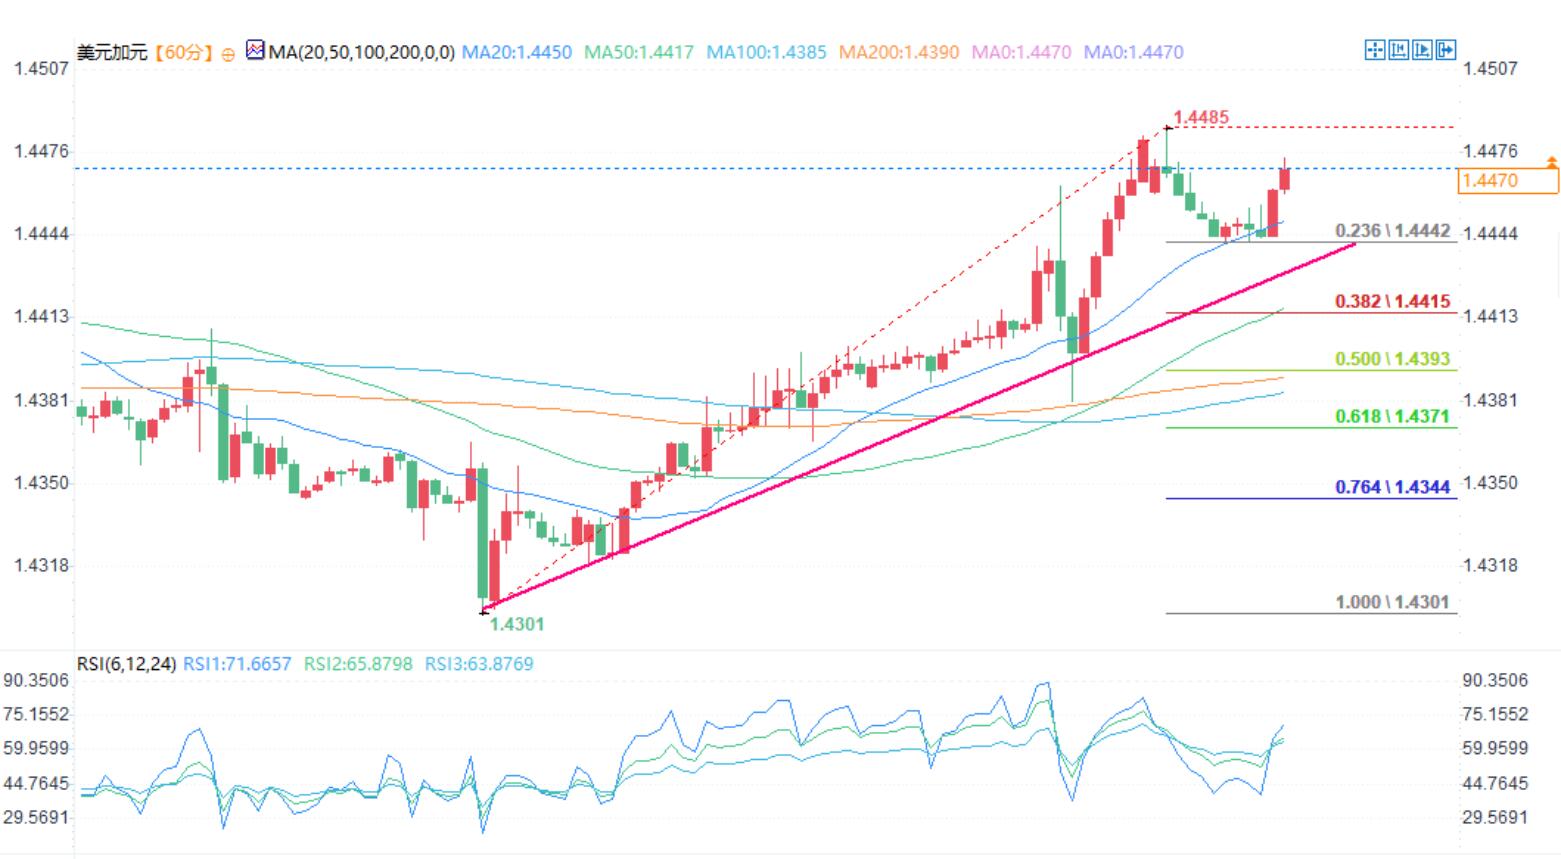
On the hourly chart, the GBP/USD formed a short-term bearish trend line with resistance at 1.2205. The US dollar/Canadian dollar shows a positive signal above the support area of 1.4400. A key bullish trend line has been formed, with support at 1.4420.
GBP/USD Technical Analysis

On the hourly chart of GBP/USD, GBP/USD continues to rise above the resistance level of 1.2320. The pound has started a new round of decline, with the pound/dollar falling below the support zone around 1.2270.
The currency pair even fell below 1.2250 and the 50 hour simple moving average. Eventually, bulls appeared around the 1.2100 level. The recent low point of volatility has formed at 1.2160, and the currency pair is currently consolidating its decline.
On the upward side, the direct resistance is at a short-term bearish trend line around 1.2205. The first major resistance is around the 1.2230 area, as well as around the 50% Fibonacci retracement level of the downward trend from the fluctuation high of 1.2305 to the low of 1.2160.
The main resistance is at 1.2270 and the 76.4% Fibonacci retracement level of the downward trend from the fluctuation high of 1.2305 to the low of 1.2160. If the closing price is above the resistance level of 1.2270, it may trigger a steady upward trend.
The next major resistance is around the 1.2305 area. If there is further increase, the currency pair may move towards the resistance level of 1.2320 in the short term.
The initial support level is 1.2160. The next major support level is at 1.2140, and there is a risk of another significant decline if it falls below this level. In the above situation, the currency pair may fall to 1.2100.
USD/CAD Technical Analysis

On the hourly chart of USD/CAD, the currency pair has formed a strong support base above the 1.4300 level. The US dollar/Canadian dollar has started a new round of upward movement above the resistance level of 1.4345.
The bulls are pushing the currency pair to break through the levels of 1.4380 and 1.4400. The currency pair broke through the 50 hour simple moving average and climbed above 1.4450. The high point was formed at 1.4485, and the currency pair experienced a partial correction in its gains.
There has been a pullback to the 23.6% Fibonacci retracement level, which has been trending upwards from the low point of 1.4302 to the high point of 1.4485. The initial support is around the level of 1.4420.
At the same time, a key bullish trend line was formed, with support at 1.4420. The next major support is around the 1.4395 level, which is the 50% Fibonacci retracement level of the upward trend from the fluctuation low of 1.4302 to the high of 1.4485.
Mainly supported around the 1.4345 area on the same USD/CAD chart. If it falls below the level of 1.4345, it may push the currency pair further downwards. The next major support is around the 1.4300 support area, and if it falls below this level, the currency pair may explore 1.4250.
If it rises again, the currency pair may face resistance near the level of 1.4485. If there is a clear breakthrough above 1.4485, it may initiate another steady upward trend. The next major resistance is at the 1.4540 level.
If the closing price is above the 1.4540 level, it may push the currency pair towards the 1.4580 level. Further increases may open the door for testing the 1.4620 level.
Tips:This page came from Internet, which is not standing for FXCUE opinions of this website.
Statement:Contact us if the content violates the law or your rights
