Forex Market Analysis: Can AUD/USD and EUR/USD break through resistance?
On Tuesday (January 21st) during the European trading session, the Australian dollar/US dollar and Euro/US dollar rebounded from yesterday's sharp rise.
On Monday, the Trump administration did not immediately implement tariff measures, triggering a significant increase in cyclical assets, especially those related to China, and the market quickly lifted worst-case trade policy expectations. This shift has caused the Australian dollar/US dollar and Euro/US dollar to soar, breaking through key long-term resistance levels.
Is this rebound a false dawn, foreshadowing an epic bull trap? The threat of tariffs has not disappeared, and the headline risk in the coming days remains extremely high. The market is currently waiting for an unpublished fact sheet that will outline Trump's next steps in trade policy, with details that will have a trillion dollar impact on the market.
This article will focus on key price points that traders need to pay attention to in the coming days, providing a roadmap for them to evaluate trading opportunities based on price trends.
Tariff threat postponed, but not eradicated
In his presidential inauguration speech, Trump briefly mentioned trade policy, stating, "We will not enrich other countries by taxing our own citizens, but by taxing foreign countries to enrich our citizens
According to Bloomberg, Trump has not announced specific measures, but has instructed his team to address unfair trade practices worldwide and investigate whether the agreements he signed during his first term have been fulfilled.
The accompanying fact sheet warns that measures will be taken to reverse the destructive impact of trade policies that prioritize globalism and American interests.
AUD/USD: Is it a sustained breakout or a trap?

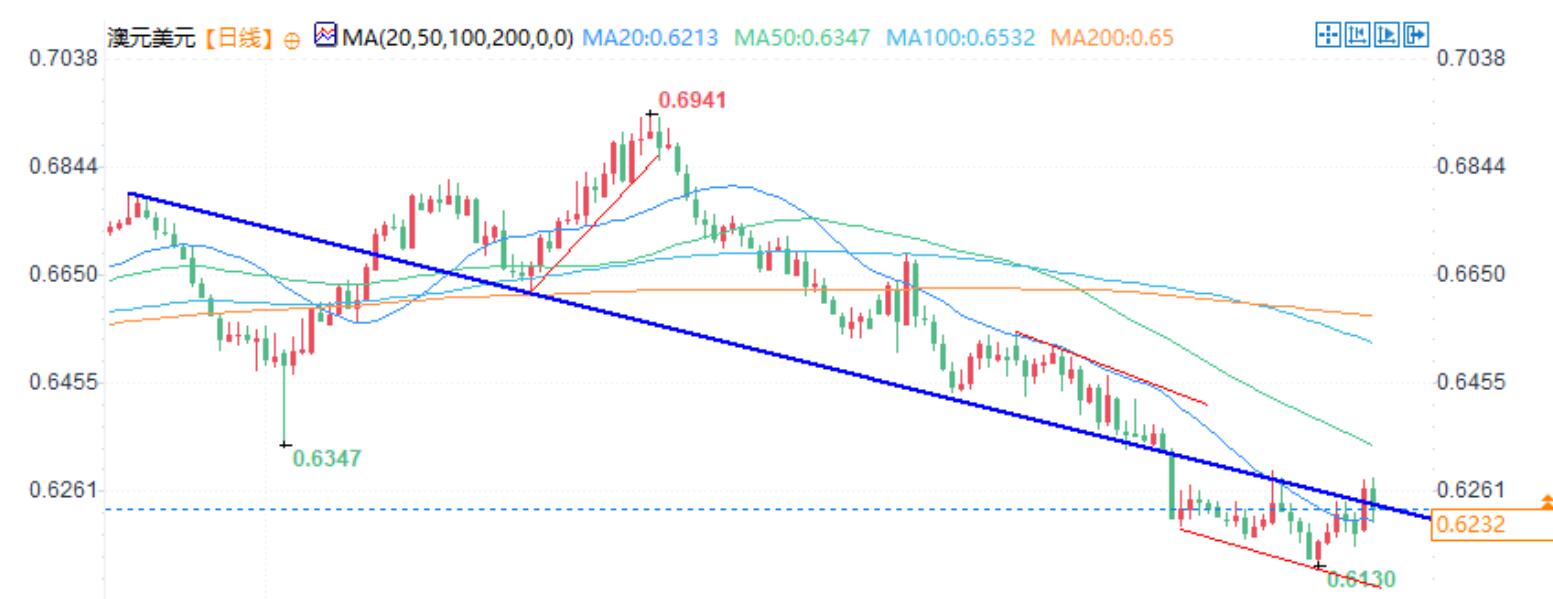
The Australian dollar is widely regarded as a barometer of the Chinese economy and has become one of the most volatile currencies under the influence of trade-related news. The Australian dollar/US dollar has risen sharply, breaking the long-term downward trend line that has been supporting and resisting since July last year.
Although this trend is remarkable, it is worth noting that the US market has reduced liquidity due to the Martin Luther King Day holiday, which may have amplified the scale of the rebound. This has raised doubts about the reliability of the signal, especially as the tariff threat has only been postponed rather than eliminated. As similar situations have shown recently, this can easily evolve into another bullish trap.
To determine the sustainability of this bullish breakout, prices need to close above the trend line when the US market reopens on Tuesday. This is particularly crucial because the current trend line coincides with the smaller level of 0.6247, which was previously a resistance level last week.
If the price stabilizes and closes above that level, it will form a good bullish pattern. Long positions can be established above 0.6247 and stop losses can be set below for protection. At the high point of 0.6302 on January 2nd, there may be some minor resistance, but the 50 day moving average and the long-term upward trend line since the pandemic low provide a more attractive target price.
Momentum indicators, including the relative strength index RSI (14) and the index smoothed moving average MACD, are sending bullish signals, both showing an upward trend.
However, if the Australian dollar/US dollar reverses and closes below 0.6247, the bullish signal will be invalidated. This may lead to a reversal of trading patterns, and short positions can be established below this level, with stop losses set above for protection. The potential target price includes 0.6170 and 0.6130 near the low point on January 13th.
EUR/USD achieves convincing breakthrough, aiming at 50 day moving average

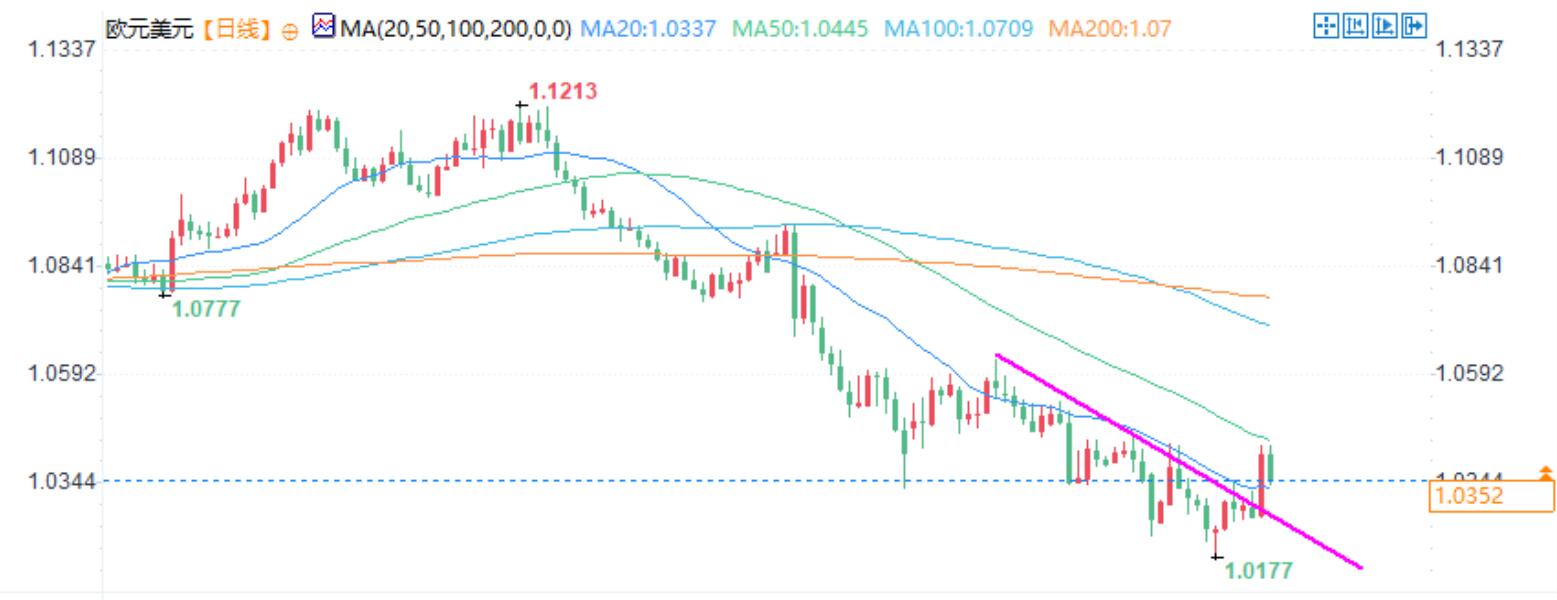
The trend of EUR/USD is similar to that of AUD/USD, breaking through the downward wedge pattern that has been in place for the past two months. The strength of this upward breakthrough seems more convincing, not only breaking through the downward trend line, but also exceeding the level of 1.0345, which has served as support and resistance multiple times in recent months.
Monday's rebound stalled around 1.0430, similar to another counter trend rebound earlier this year. The current price is slightly below the 50 day moving average. If the closing price is higher than this level, it may attract hesitant bulls to join the breakout market, opening the door to move towards 1.0544 or 1.0600.
The momentum indicators, including the relative strength index RSI (14) and the index smoothing moving average MACD, show that bearish momentum is gradually weakening and has turned positive, which is favorable for bulls.
However, if the price reverses and closes below 1.0345, it will negate the bullish signal and open the door to potential bearish trading patterns, potentially retesting the support area starting from 1.0222.
Tips:This page came from Internet, which is not standing for FXCUE opinions of this website.
Statement:Contact us if the content violates the law or your rights
