Forex Trading Analysis: USD/CAD, USD/JPY, GBP/USD
Given that the accuracy of this week's ADP employment data in predicting the growth direction of non farm employment on a month on month basis is even lower than flipping a coin, we may not overly value any positive signals brought by this data. However, since the outbreak of the pandemic, for about two-thirds of the time, forecasters have generally been overly pessimistic about the overall data of non farm employment, and this situation has been the same in the past 12 months. Therefore, based on last month's data exceeding 200000, today's forecast for non farm employment is 154000, and perhaps the above factors should be taken into account.
Although strong non farm payroll data may drive the US dollar up, if the data is weak, the decline in the US dollar will be even greater. However, the possibility of weak data is unlikely.
As expected, market volatility was suppressed before the release of the non farm payroll report, but implied volatility surged significantly. The 1-day implied volatility of USD/JPY is almost twice its 10 day average, while the implied volatility of GBP/USD and EUR/USD is about 50% higher than usual.
USD/CAD Technical Analysis
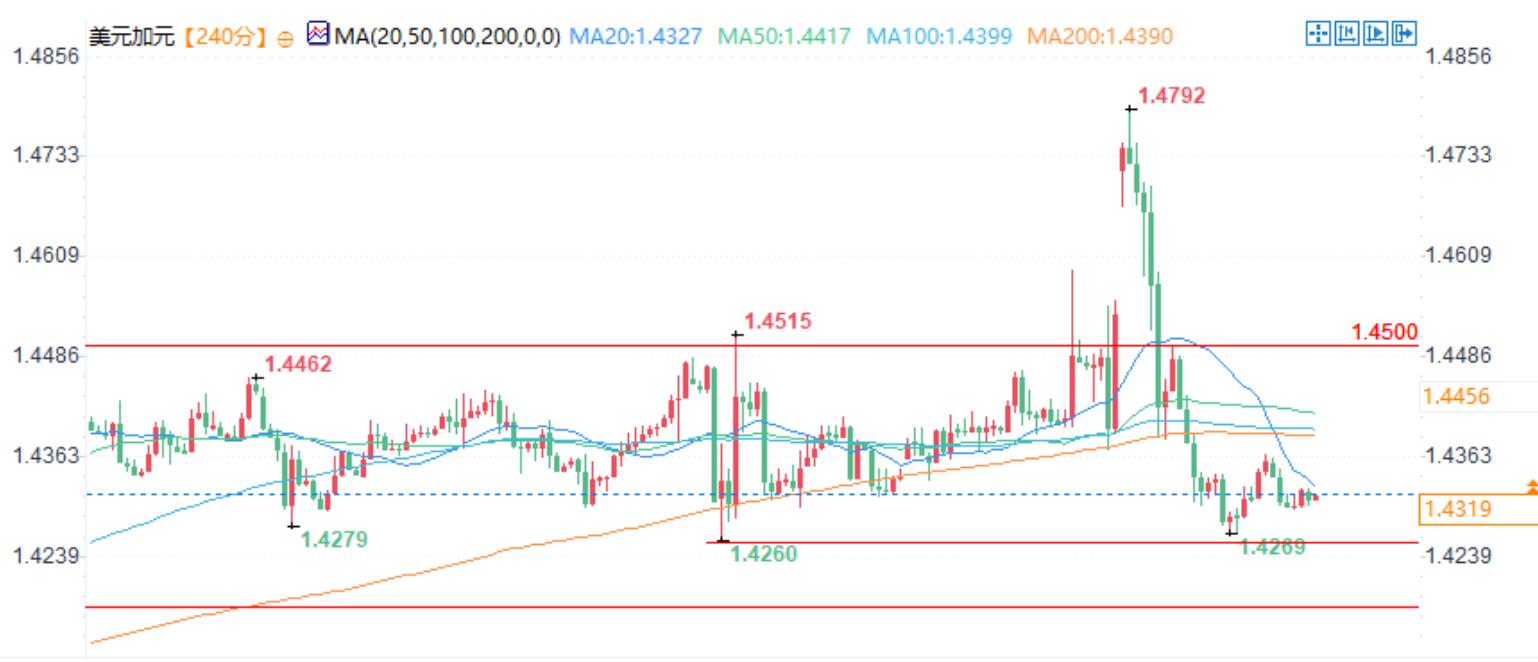
For the Canadian dollar, this has been a quite turbulent week. On Monday, under the influence of Trump's tariff policy, the US dollar/Canadian dollar soared to a 22 year high, and then the "30 day suspension" measure brought it back sharply, hitting the biggest day of fluctuation since the COVID-19 epidemic. At present, the trading price of the currency pair is slightly higher than the low point of this week, and it is almost certain that a bearish trend will emerge this week. The question is whether we will see a slight rebound before the weekend (strong non farm payroll data, weak Canadian employment data), or continue to decline, forming a larger bearish pattern.
The 4-hour chart shows the intensity of Monday's reversal, which may indicate that the upward rebound may be limited. For example, I doubt if it can rebound to the high of March 2020 closing price around 1.45, let alone break through that level. But if it tries to rise, bears will wait for an opportunity to suppress it. Pay attention to the high volume node (HVN) at 1.4386, which may pose resistance and indicate the end of the three wave rebound, followed by a return to the downtrend.
Technical Analysis of USD/JPY
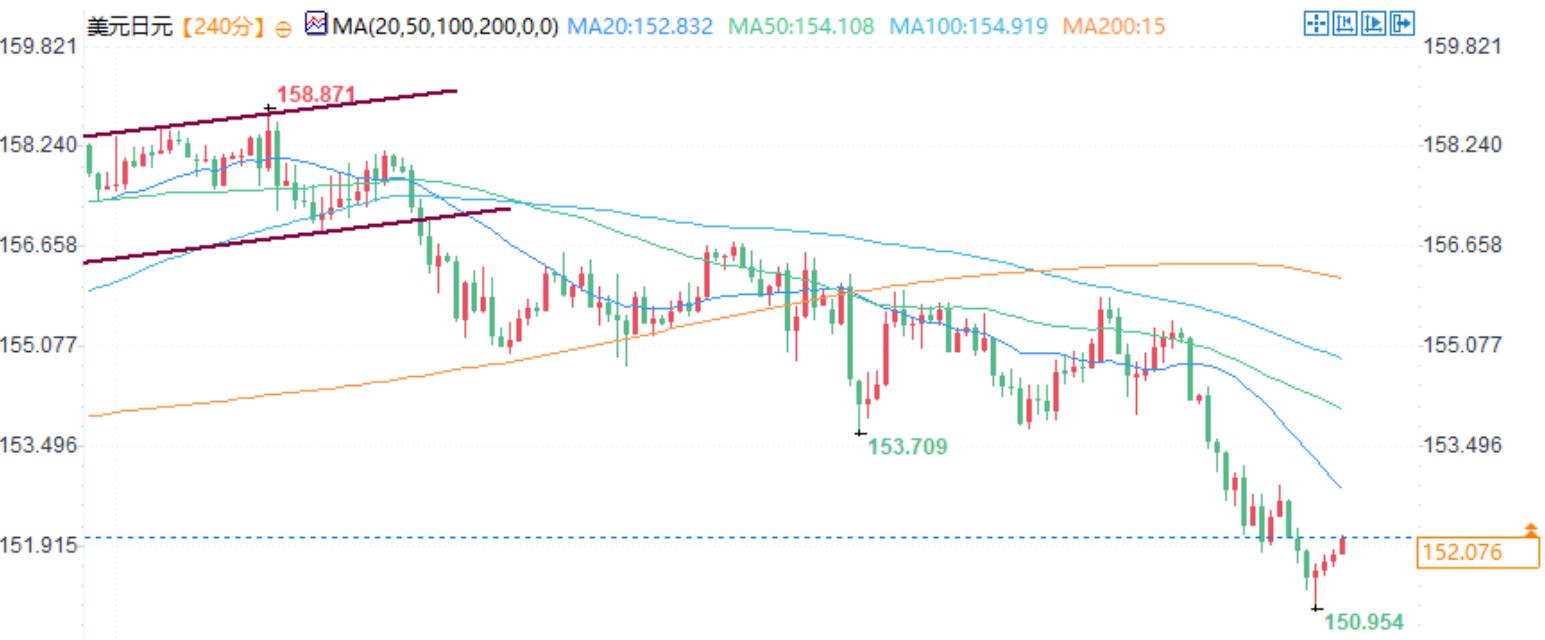
Since the false high in January, the US dollar/Japanese yen has fallen by 5%, with this week's decline accounting for about half of it. Against the backdrop of tariff news, the expectation of the Bank of Japan raising interest rates has led to a strong performance of the Japanese yen against all major foreign currencies, including the US dollar.
However, on Thursday, the daily relative strength index (RSI (2)) of the US dollar/Japanese yen reached its most oversold level of the year, forming a bullish divergence within the oversold area on the 4-hour chart. The price also attempts to maintain above the S3 pivot point of the week, which is typically only tested during weeks with significant fluctuations. Therefore, if the non farm employment data performs strongly again, the US dollar/Japanese yen may rebound before the weekend. Pay attention to the high volume node (HVN) near 152.30. If there is a counter trend, it may both attract prices and create resistance. But at this stage, fundamental factors support the USD/JPY falling to 150 after any such rebound.
GBP/USD Technical Analysis
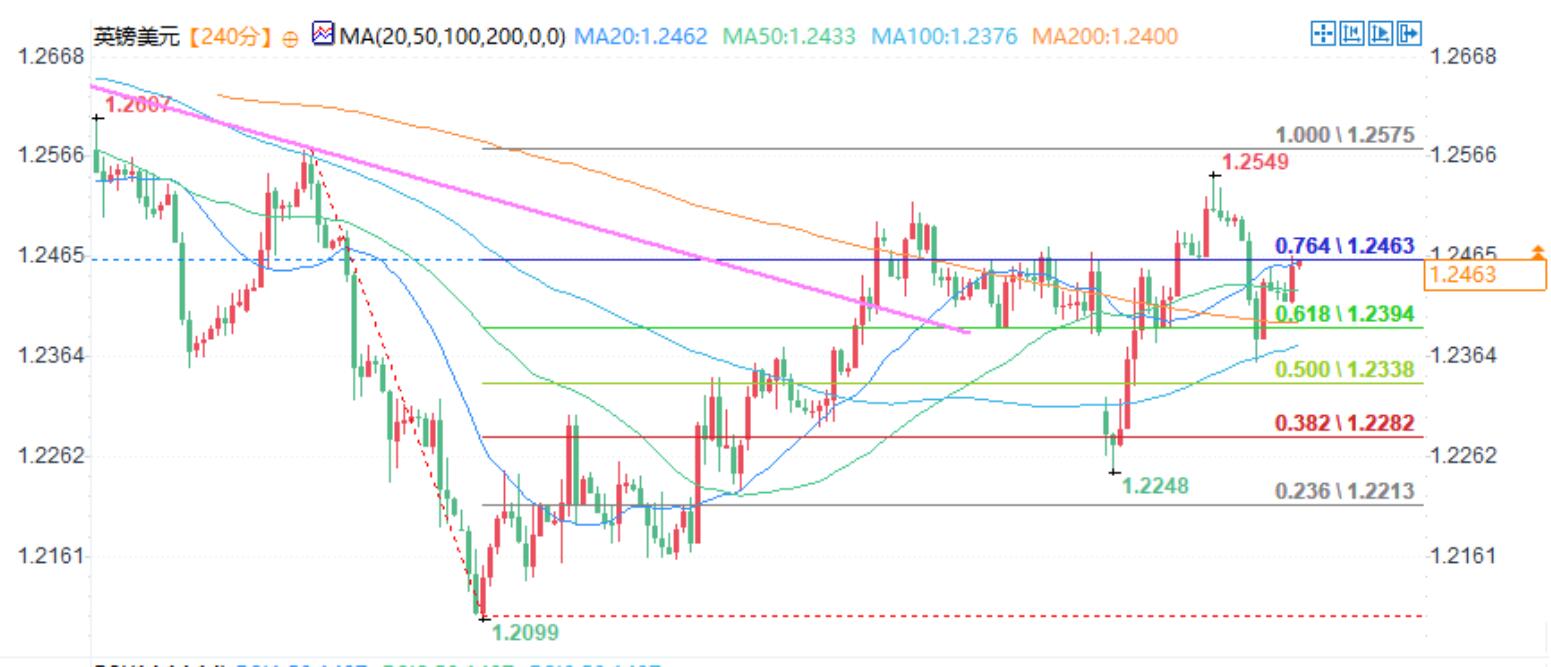
Since falling below 1.25 on January 2nd, the pound has been struggling to recover from that level. Previously, there were three failed attempts to break the upper limit. On Thursday, due to the dovish interest rate cut by the Bank of England, a bearish trend engulfed the daily candlestick, causing the pound to weaken again. At present, there is a tendency to short during a slight rebound, and it is expected that the pound will further decline.
The 1-hour chart shows a potential upward flag, but since it is not formed within an upward trend, I am skeptical of any upward breakthrough. Especially if we see signs of a swing high point forming around 1.2460.
As long as the price remains below 1.25, bears may target the swing low point of 1.226 and the high volume node (HVN) of 1.2311.
Tips:This page came from Internet, which is not standing for FXCUE opinions of this website.
Statement:Contact us if the content violates the law or your rights