Gold pullback still holds momentum, strength is still expected
In the second half of December 2024, after completing the correction of the triangular oscillation, gold began its upward trend from the low point of 2583, and the market price continued to rise for 7 consecutive weeks, showing a strong upward momentum. In the previous trading week, the price of gold surged to the level of $2942, breaking historical highs before falling back. The weekly chart ultimately closed with a long bullish candlestick, showing a strong pattern of seven consecutive bullish days, which is sufficient to prove the strength of this round of upward trend.
However, on Friday, the gold price surged by $2950 and quickly fell back, with the daily chart turning negative and closing at a low level. This change has triggered market attention to the subsequent trend of the market. From a news perspective, the financial market has been volatile over the past week, with frequent shocks from tariffs, inflation, and related news from the Federal Reserve. Trump's plan to impose tariffs on trading partners has intensified market uncertainty; The US CPI report shows that consumer inflation is rising. Powell admitted that the financial price foam needs to be further eliminated, which cooled the expectation of interest rate cut. These factors together led to the decline of gold price. The subsequently released retail data showed extremely poor performance, although it brought a glimmer of hope to the gold trend, it failed to effectively push up the gold price. On Friday, the gold price fell sharply at the end of the trading day, and the daily chart closed negative.
According to the latest news, on the night of February 15th local time, a large number of American made heavy bombs were transported by ships to Israel. These bombs were then loaded onto dozens of trucks and transported to the Israeli Air Force base. In late January of this year, foreign media reported that White House sources revealed that US President Trump had instructed the US military to lift Biden's ban on supplying 2000 pounds of bombs to Israel. In addition, just as US Secretary of State Rubio was preparing to meet with Israeli Prime Minister Netanyahu last Sunday, a batch of 2000 pound bombs detained by the Biden administration were transported to Israel overnight. This indicates that the policies pursued by the Trump administration on the Middle East issue are completely different from those of the previous administration. Trump's willingness to provide heavy weapons indicates his readiness to make Israel more free in the fight against Hamas.
Hamas stated that three Palestinian police officers were killed last Sunday while ensuring the safe delivery of aid near Rafa, highlighting the fragility of the ceasefire. Gaza ceasefire agreement faces test, Israel is highly likely to restart war
On Thursday, Trump unveiled a roadmap for imposing equivalent tariffs on every country that imposes tariffs on American imports. This is a new round of offensive against America's friends and enemies, intensifying the possibility of a global trade war.
According to data from the World Gold Council, global physical gold ETFs achieved a net inflow of funds in the first month of 2025. As of the end of January, the total asset management scale of global gold ETFs has risen to $294 billion, setting a new record level, with holdings increasing by 34 tons. The average daily trading volume of gold in the global market in January was $264 billion, an increase of 20% compared to the previous month.
Driven by factors such as geopolitical risks, tariffs, central bank purchases of gold, and the ongoing Fed interest rate cut cycle, it is highly probable that gold will continue to perform strongly in the medium to long term.
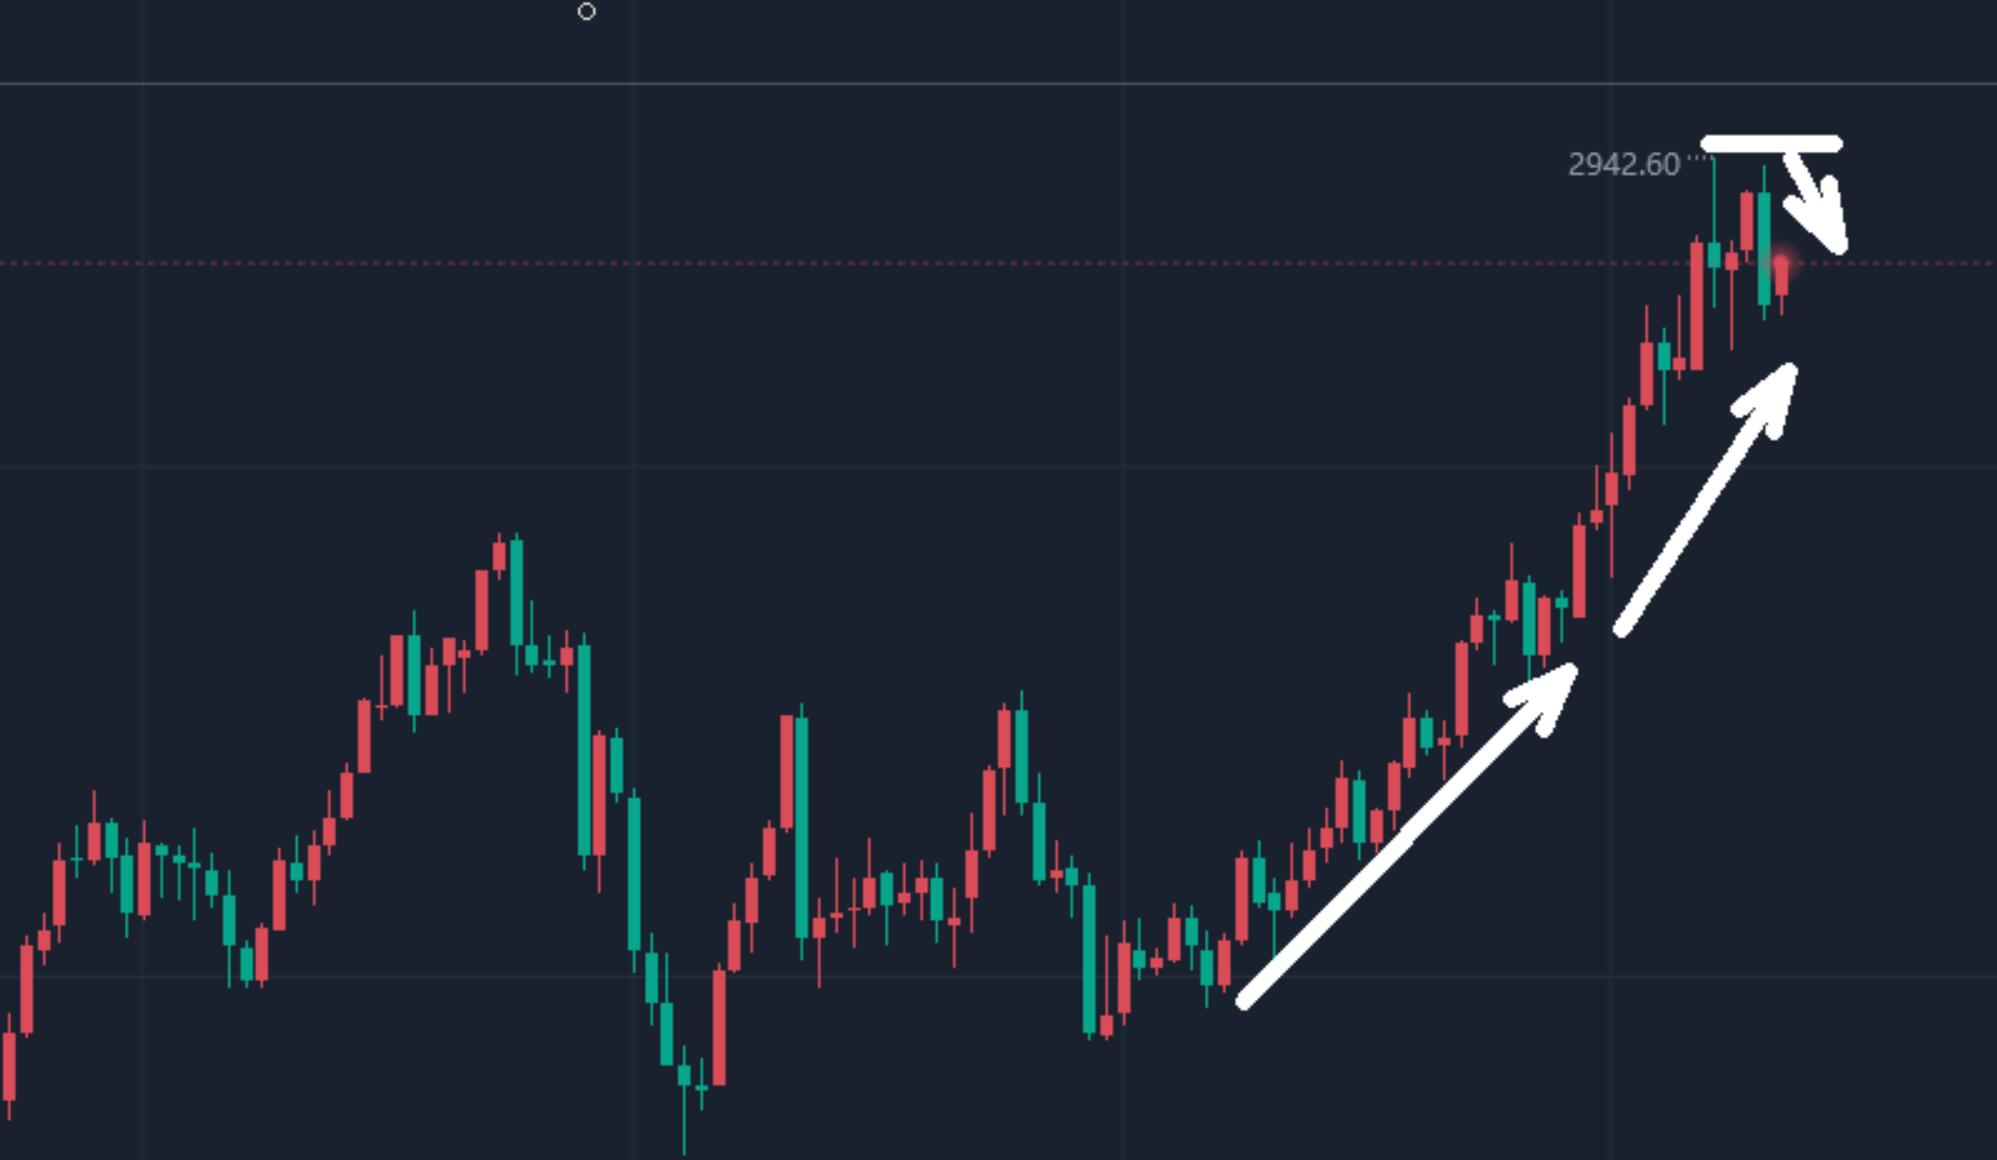
Technically speaking, although the daily chart closed negative, it does not necessarily mean a change in the upward trend of gold. The daily closing line did not fall below the previous correction low of 2865, and the retracement did not break through the low, indicating that the market is still in the correction range. The gold market has always shown a pattern of rising and adjusting at the same time. From the daily structure, there is a correction after each round of rise, and after the correction is completed, it continues to rise. Although the price at $2940 did not break through successfully, the previous high movement and the long upper shadow closing line at $2942 indicate significant pressure at this level, and the price needs to retrace and accumulate momentum for future breakthroughs. Previously, when gold hit the 2927-2945 range, it took three attempts to successfully break through. Therefore, there is a high possibility of hitting this position again after accumulating energy and achieving a breakthrough. We should continue to be optimistic about the bulls and maintain a bullish trend.
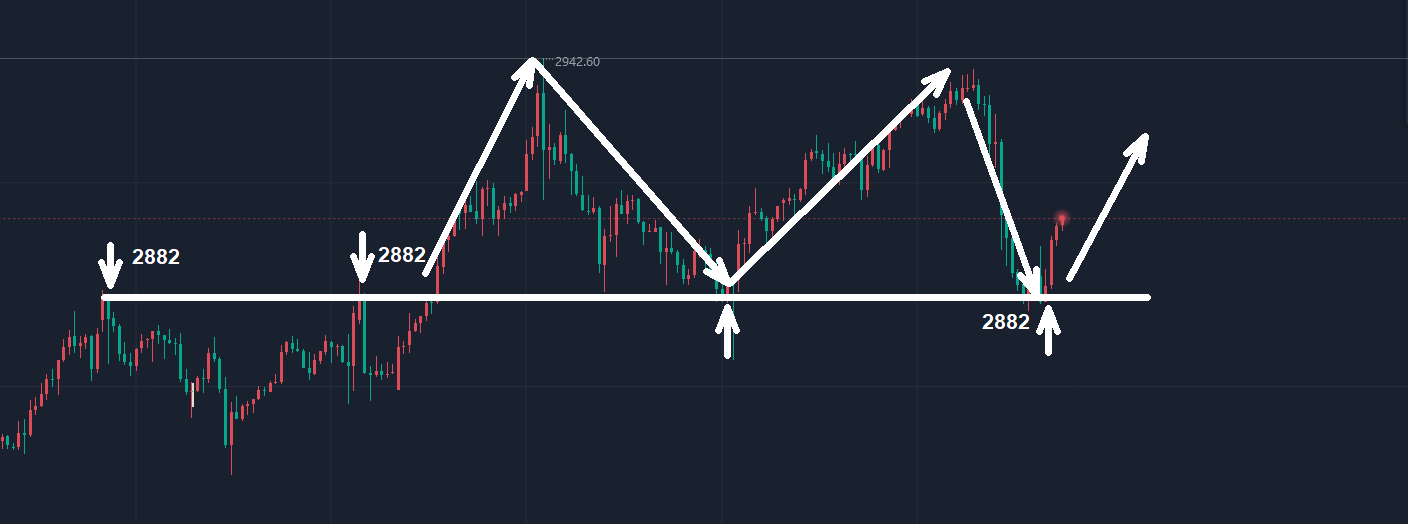
In the short term, the market price has just touched the support band below 2880-2882, which is the top bottom transition position in the early stage. Last Tuesday, the gold price bottomed out and rebounded here, gaining support, and there is a possibility of forming a double bottom in the short term. Therefore, the focus of this trading day is on this support level. As long as this support level is effective, we can continue to bullish on gold and look forward to a rebound and closing. A single bearish candlestick is not enough to change the current upward trend, and it is still considered a correction. In terms of operation, the low bullish layout is still the main approach.
Investment carries risks, and caution should be exercised when entering the market. The above suggestions are for reference only.
Tips:This page came from Internet, which is not standing for FXCUE opinions of this website.
Statement:Contact us if the content violates the law or your rights