2.18 Gold daily decline temporarily suspended, head shape to be confirmed
Yesterday's Market Review
Affected by the US market shutdown, gold prices showed a narrow range of fluctuations yesterday, reaching a high of 2906 and a low of 2876, with a volatility of $30. Finally, the daily line closed lower at the bullish line. The overall trend is in line with our expectations, and the price has not formed an effective continuation after the decline.
Technical analysis
Daily chart:
Last Friday, the price rose to 2940 and encountered a second suppression, falling back with a large bearish candlestick.
On Monday of this week, the price did not break through its previous low, continuing the pattern of the past year.
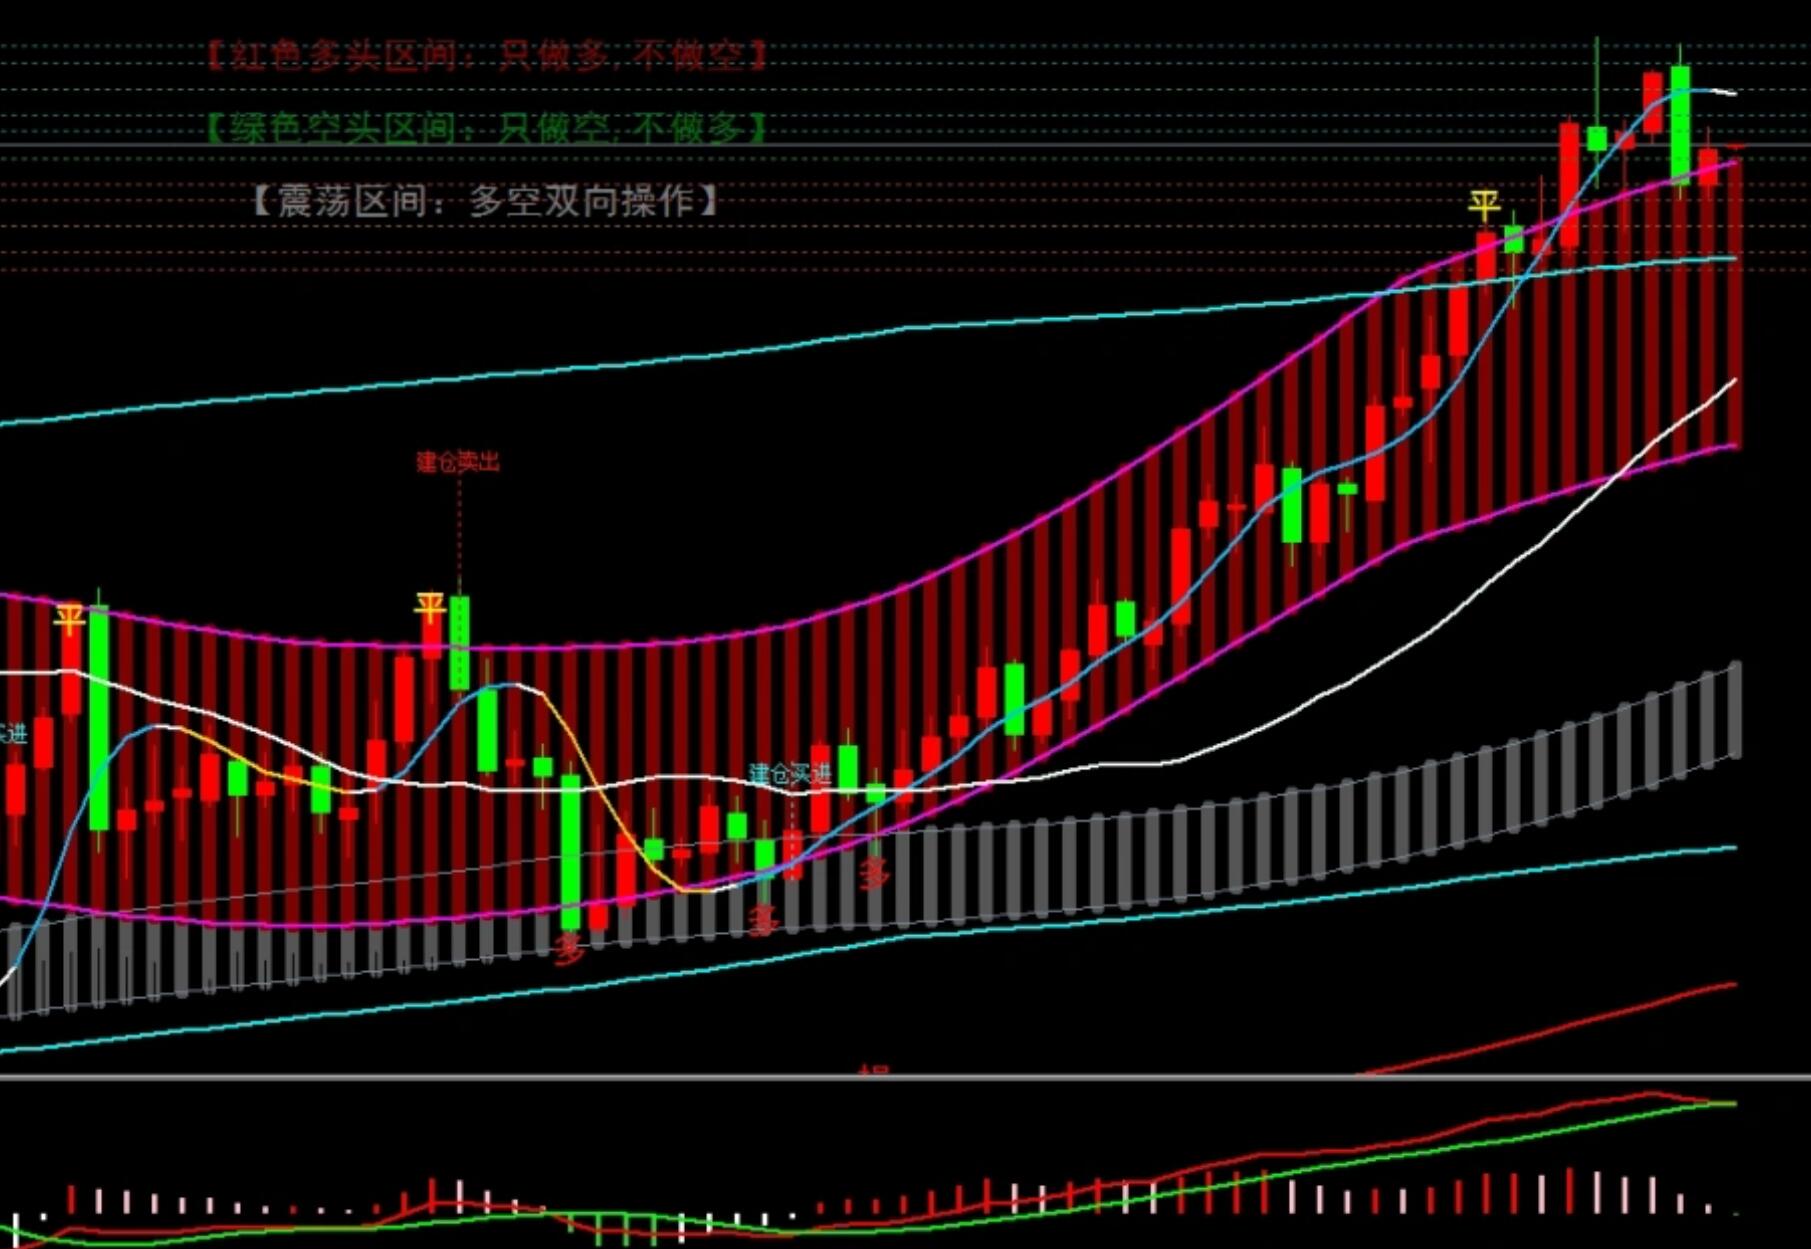
The price briefly broke through the offline and then returned to the online market. The main chart shows a weak bearish signal, but further confirmation is needed.
The MACD indicator in the secondary chart is stuck at a high level, indicating the formation of a dead cross and suggesting downward risk.
2.4-hour chart:
After the bearish candlestick falls below the lower line, a cross star and a bullish candlestick appear, and the price temporarily recovers some lost ground, but the rebound is relatively weak.
Pay close attention to the recovery of the 26 day moving average. If the price rebounds to this moving average, it is expected to initiate a cycle of up and down lines and fill the gap on the daily chart.
3. Hour chart:
The price remains fluctuating between the upper and lower limits, and the short-term direction is unclear.
3、 Comprehensive analysis
In the long run, the price of gold is still in an upward trend, and a short-term decline of several tens of dollars is difficult to change the direction of the trend. Whether 2942 is a stage top or not, the construction and confirmation of the head shape require an iterative process. Therefore, it is recommended to adopt a strategy of long first and then short for intraday operations.
4、 Operational suggestions
Multiple orders: If the price falls back to the 2888 area, you can buy long with a stop loss of 83 and a target of 2906-2912. After breaking through, you can look up at 2922-2932. The price will effectively break through the short-term overlapping moving average and follow the trend. Normally, if the price falls below 88, it will not be too much, at least not a strong oscillation, but will weaken again.
Empty position: Use the area above 2932 as the stop loss level and try to layout empty positions in the 2927-2930 range. The downward trend after confirming the head form of the game.
5、 Key Points
Support positions: 2888, 2876, 2863
Pressure levels: 2906, 2912, 2922, 2932
Long short equilibrium point: 2894
Crude oil: repeatedly bottoming out, bought more around 70.65 today, lost 70, target 71.5-72.3
GBP/JPY: Buy more near 190.65, lose 190.15, fall below 191.5, buy more near 191.15, up 191.7-192.5
Risk statement
The above analysis is for reference only and does not constitute investment advice. The market is risky, and investment needs to be cautious. Please make rational decisions based on your own risk tolerance.
Tips:This page came from Internet, which is not standing for FXCUE opinions of this website.
Statement:Contact us if the content violates the law or your rights