Technical analysis of USD currency pairs: EUR/USD, GBP/USD, USD index
On July 24th, the trend of EUR/USD was influenced by the manufacturing PMI values of France and Germany (44.1 and 42.6, respectively). A weaker than expected PMI value indicates a sustained contraction in the manufacturing industry.
However, there has been a slight improvement in the service industry, with an initial service PMI of 50.7 in France and 52.0 in Germany. These mixed signals caused the euro/dollar to hover around 1.1100.
Across the English Channel, the pound/dollar showed elasticity, with a UK manufacturing PMI preview value of 51.8, exceeding expectations. The service industry PMI preview value has also remained stable at 52.4. These data help stabilize the pound around 1.2850.
In the United States, the US Dollar Index (DXY) responded to a slight decline in the manufacturing PMI preview value to 49.5, but strong service sector data provided support, with the service sector PMI preview value rising to 56.0. New home sales also exceeded expectations, reaching 617000 households, keeping the US dollar index around 101.50.
Before the event
Looking ahead to July 25th, the German IFO Business Sentiment Index is expected to slightly improve, reaching 87.0. If the data is better than expected, it may provide support for the euro.
In the United States, the focus will be on the preliminary data of GDP, with an expected growth rate of 2.0% in the second quarter. Any deviation from this number may lead to significant fluctuations in the US dollar currency pair.
In addition, the market will focus on the number of initial jobless claims, expected to be 237000, as well as durable goods orders, in search of further clues about the economic outlook. The speech by European Central Bank President Lagarde and the G20 meeting may also provide insights into future monetary policy, affecting the trend of the euro/dollar.
With the occurrence of these events, traders should be prepared for potential market fluctuations.
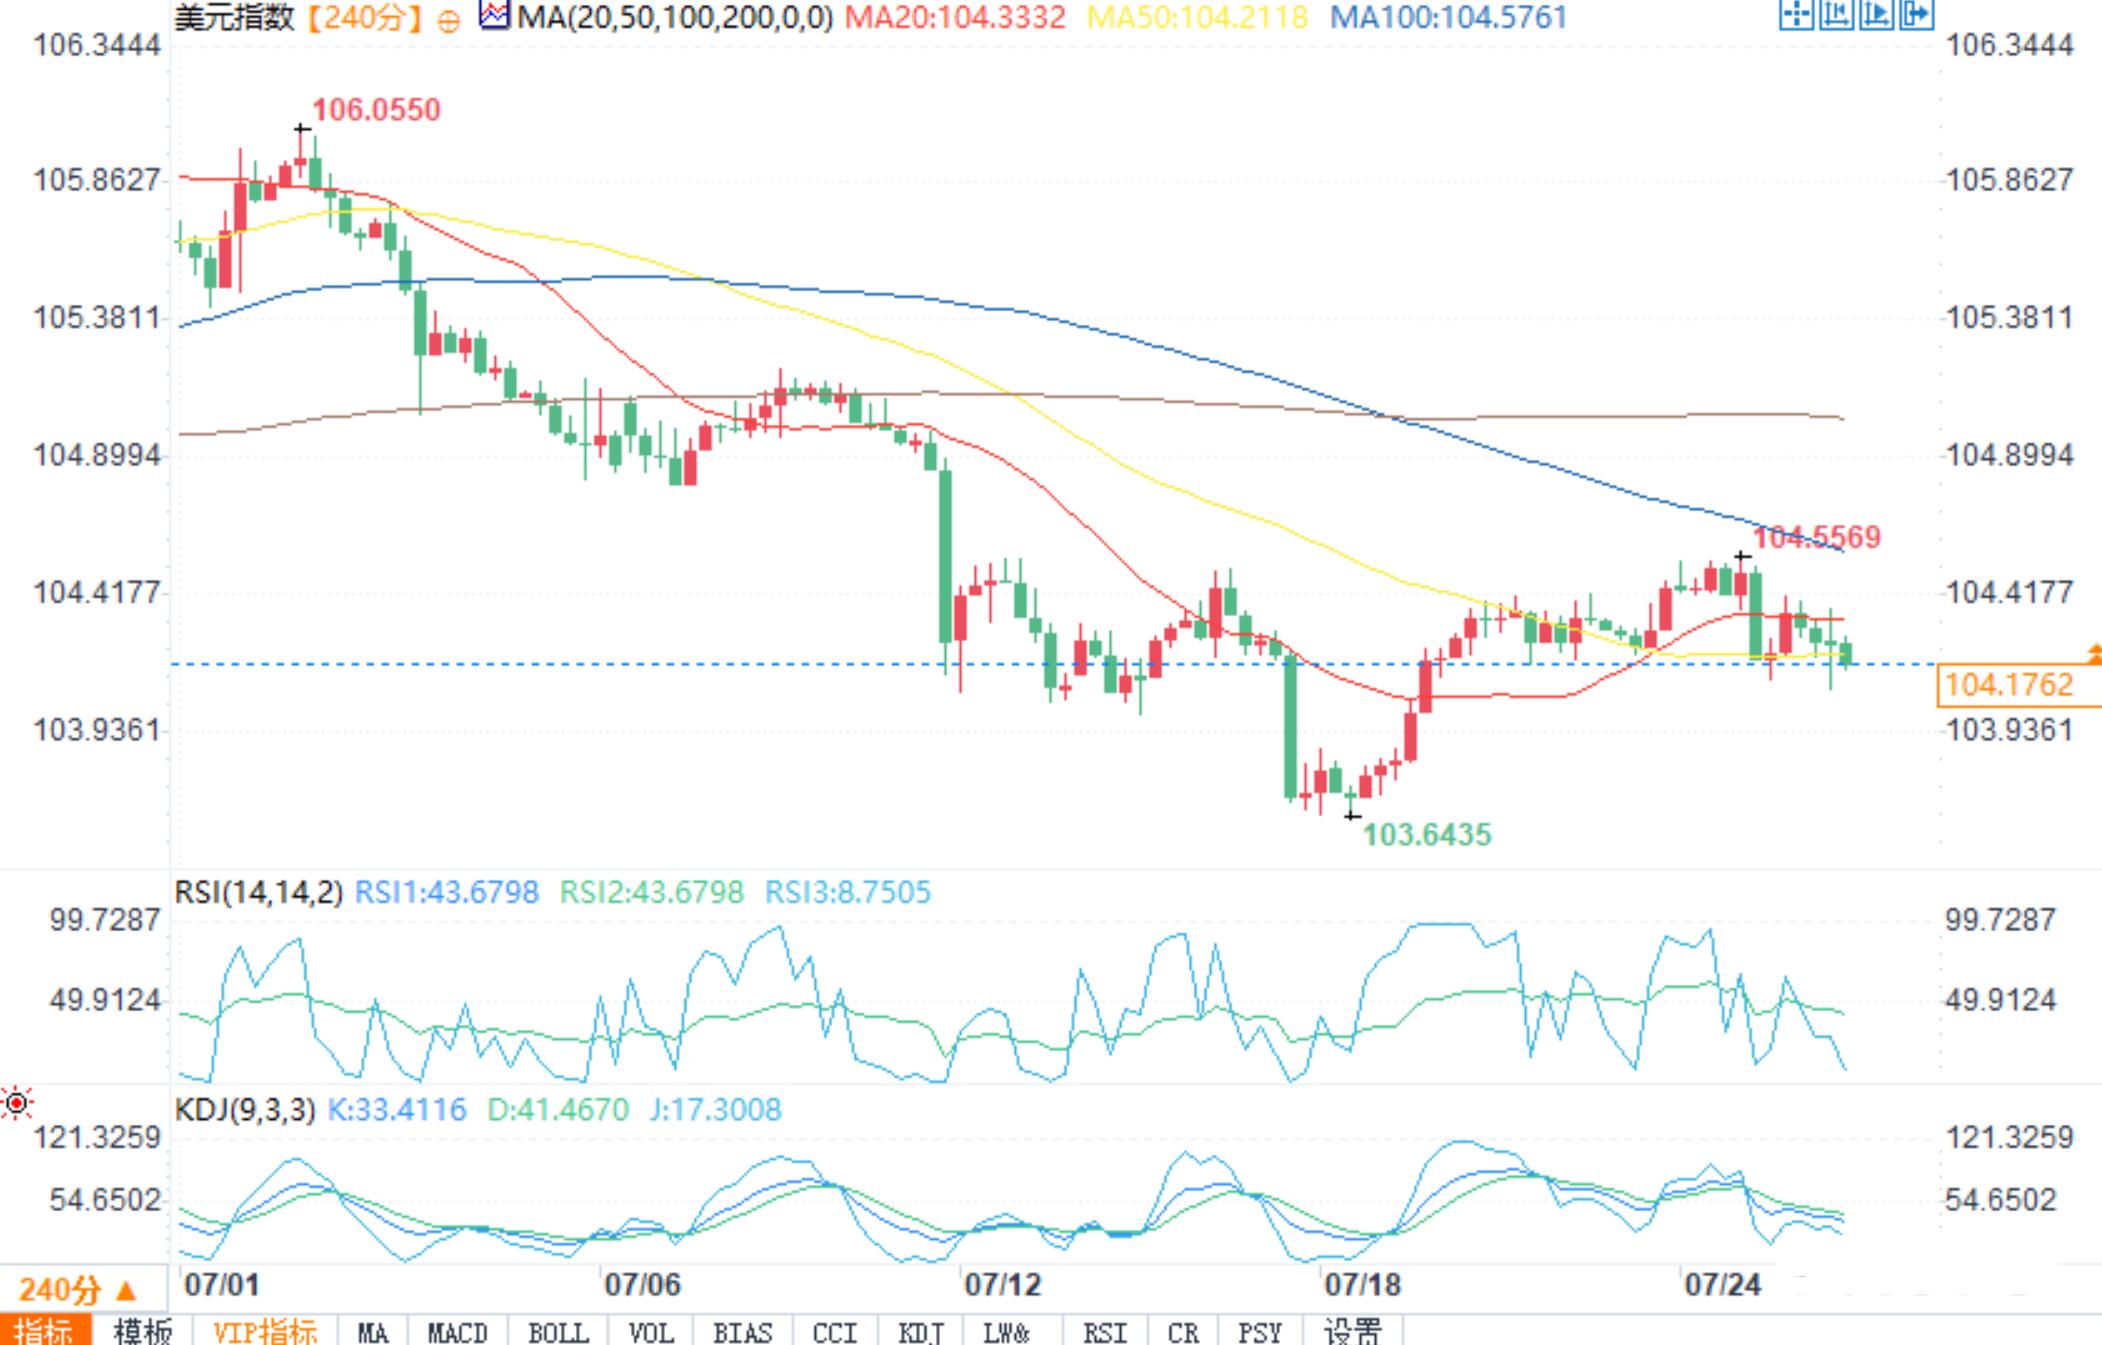
4-hour chart of the US dollar index
The current trading price of the US Dollar Index (DXY) is $104.1741, a decrease of 0.18%. The pivot point is set at $104.393. The direct resistance levels are at $104.555, $104.796, and $104.997. The recent support levels are at $104.130, $103.955, and $103.644.
The 50 day moving average is $104.359, and the 200 day moving average is $104.781. The trend is bearish below the pivot point of $104.393. Breaking through this level may shift the trend towards a bullish trend. On the contrary, staying below the pivot point indicates sustained downward momentum.
EUR/USD Technical Analysis
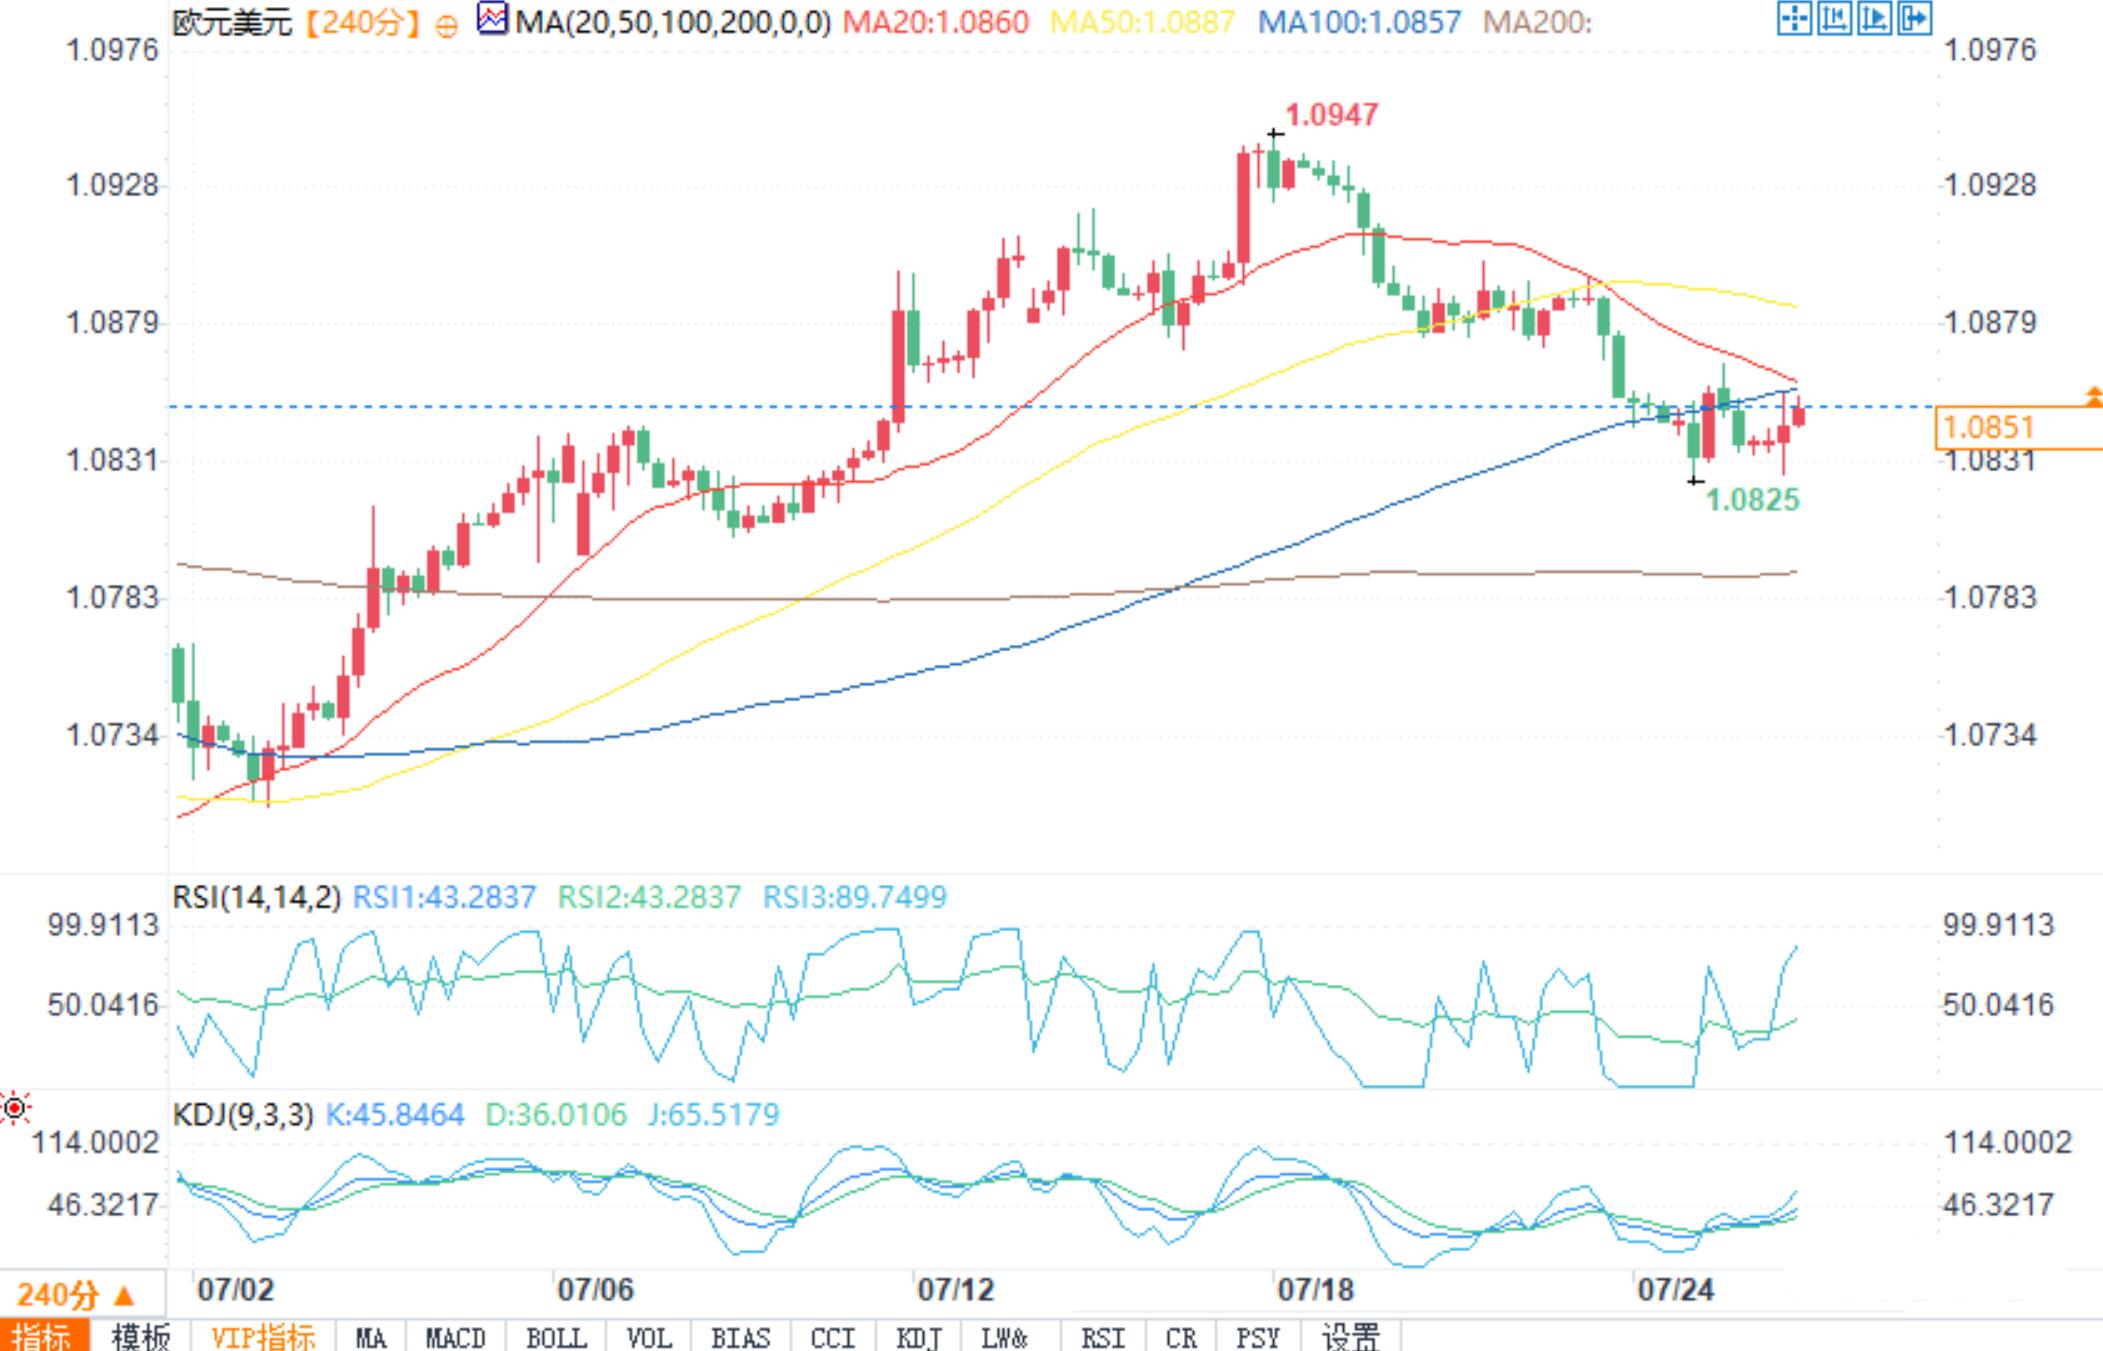
EUR/USD 4-hour chart
On the 4-hour chart, the euro/dollar traded at $1.0851, up 0.11%. The pivot point is $1.08674. The recent resistance levels are $1.09033, $1.09216, and $1.09448.
The recent support levels are at $1.08246, $1.08052, and $1.07818. The 50 day moving average is at $1.08686, and the 200 day moving average is at $1.08262.
The trend is bearish below the pivot point of $1.08674. Breaking above this level upwards may shift bias towards a bullish trend, while maintaining below this level indicates ongoing downward pressure.
GBP/USD Technical Analysis
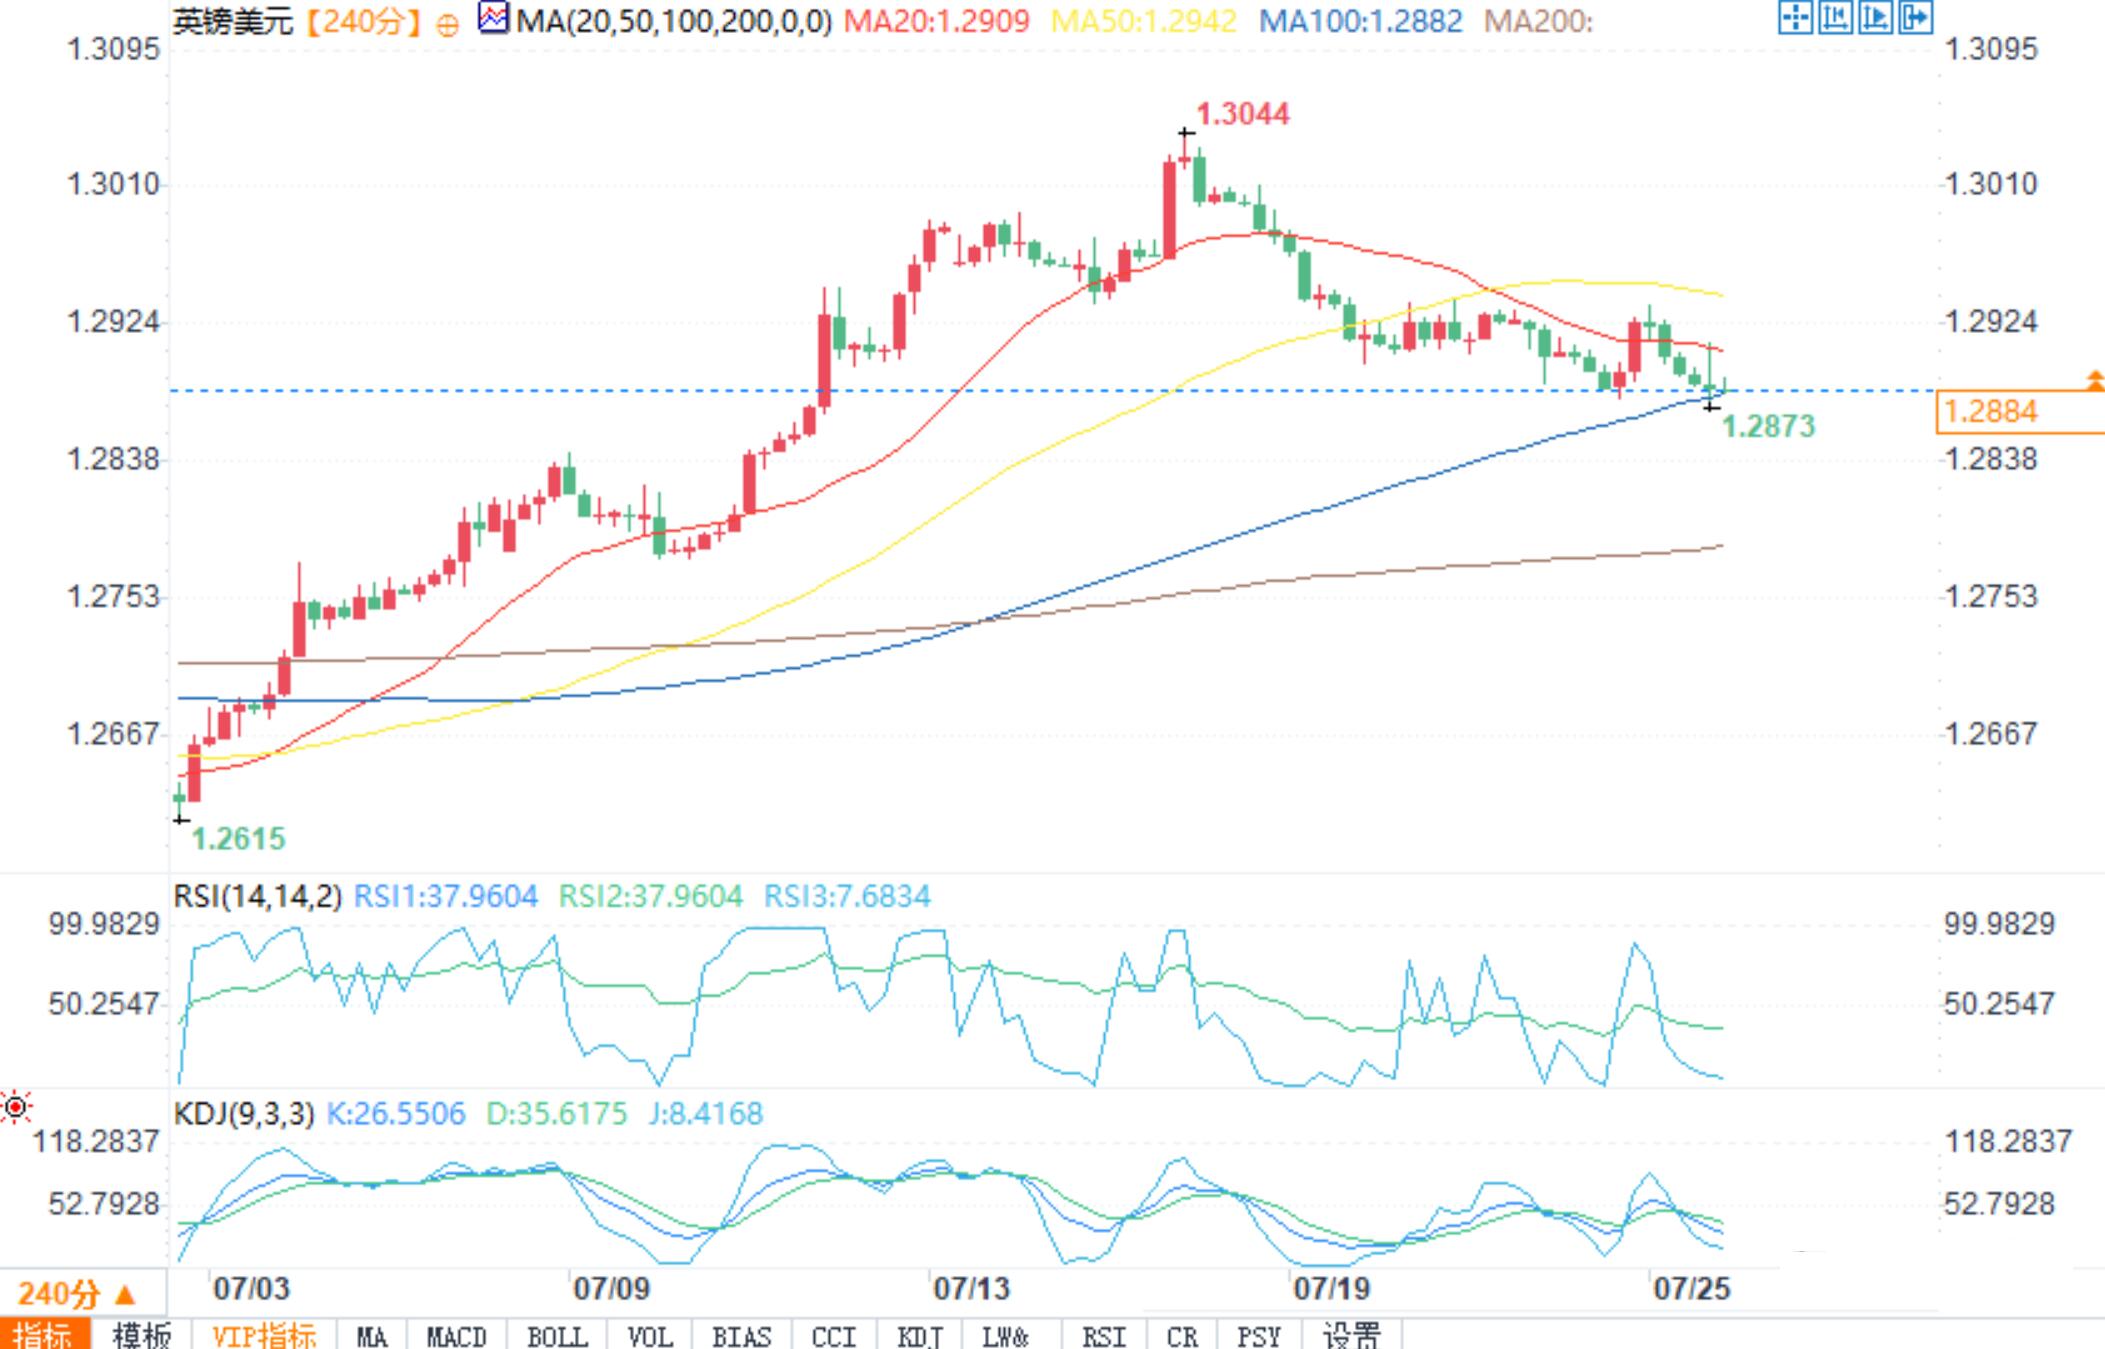
GBP/USD 4-hour chart
On the 4-hour chart, GBP/USD traded at $1.2884, down 0.17%. The pivot point is at $1.28997. The immediate resistance levels are $1.29417, $1.29791, and $1.30269. The recent support levels are at $1.28555, $1.28151, and $1.27792.
The 50 day moving average is at $1.29150, and the 200 day moving average is at $1.28168. The trend is bearish below $1.28997.
Breaking above this level upwards may shift bias towards a bullish trend, while maintaining below this level indicates ongoing downward pressure.
Tips:This page came from Internet, which is not standing for FXCUE opinions of this website.
Statement:Contact us if the content violates the law or your rights