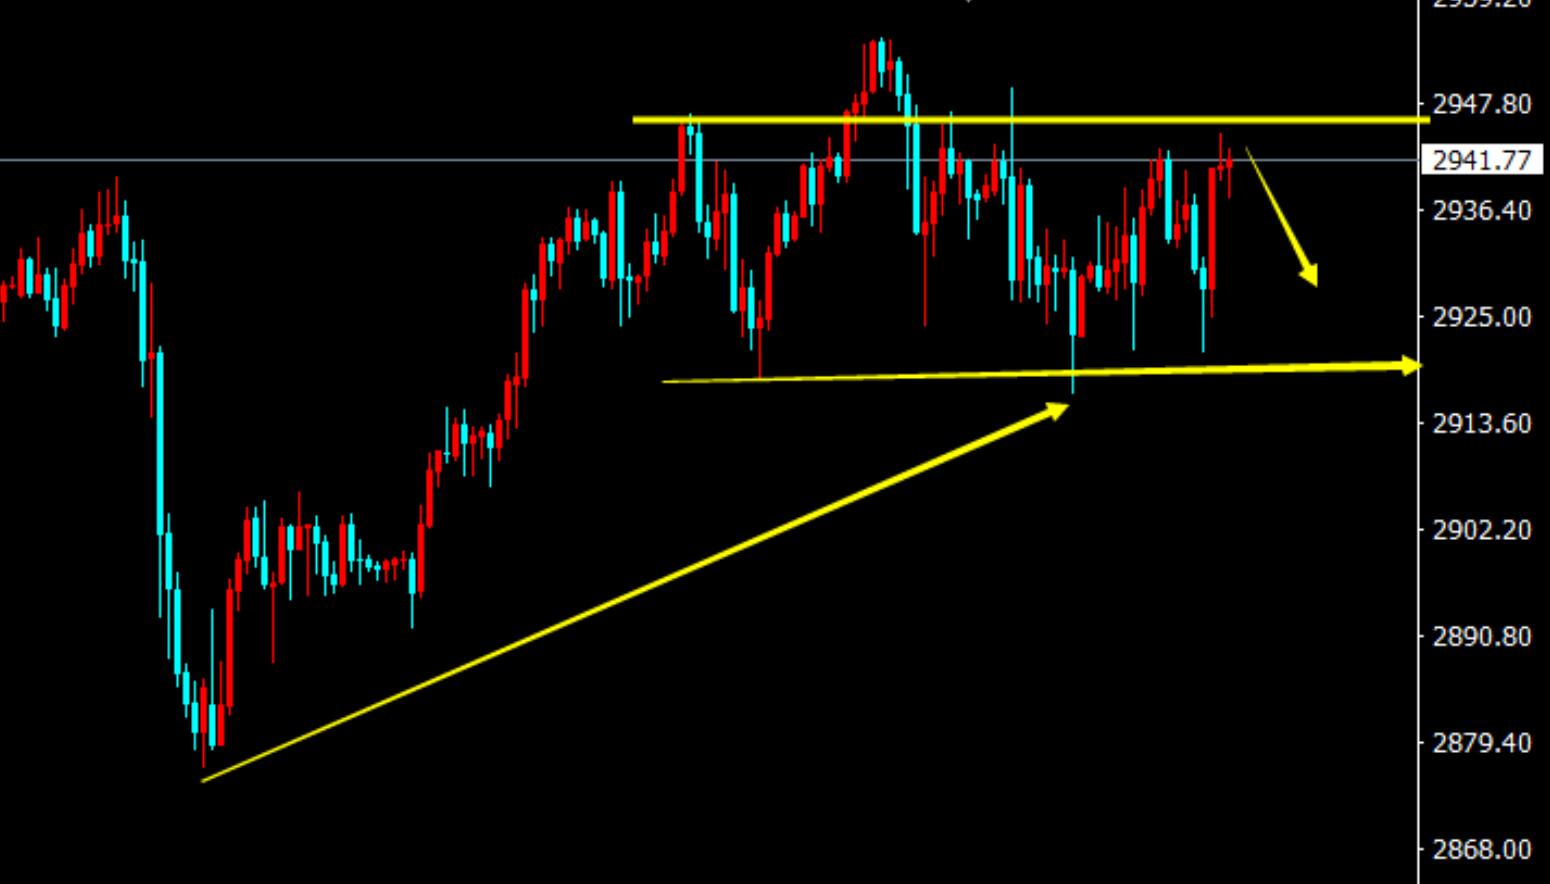
Short selling of gold 2945-46, range oscillation operation
Gold, affected by the escalation of geopolitical tensions and uncertainty in global economic recovery last week, spot gold prices fluctuated upwards, reaching a high of around 2954 and eventually closing at around 2935. The weekly chart still closed in a bullish pattern, while the daily chart was relatively conservative, closing at the bearish line of the upper and lower lines. After the intraday bottom, it has once again broken through the 2930 line and stabilized above that position. The short-term moving average shows a bullish trend, indicating that the bullish forces have the advantage, while the bulls maintain a fluctuating upward trend. The Bollinger Bands open upwards, and the indicator runs at a high level. In terms of indicators, there is still upward momentum in the short term. However, it should be noted that the daily chart has been oscillating in a high range for four consecutive trading days, which has both advantages and disadvantages for both long and short sides. It is likely to be a signal of a bullish peak. However, if it continues to rise after multiple retracements last week, it may also be a correction form of a bullish trend. Therefore, we should focus on the range oscillation during the day, and once it breaks through, we need to exit in a timely manner. Currently, the pressure on gold is maintained at the 2950 line, which is also a key suppression level in the short term. The support below is maintained at the 2920 line. If gold first withdraws around 2945-46 and goes short, the target is around 2925-20, with a loss of 2952.5.
Tips:This page came from Internet, which is not standing for FXCUE opinions of this website.
Statement:Contact us if the content violates the law or your rights