Forex analysis: US dollar index hits new low
On Monday (February 24th), the US dollar index (DXY) opened lower, reaching its lowest level since December 10th during the Asian session. The current US dollar index remains roughly around 106.30, with strong bearish sentiment and increased downward pressure on the market. According to recent data and market sentiment, the weak performance of the US dollar is influenced by multiple factors.
Firstly, the lower than expected retail sales data in the United States has raised concerns in the market about the health status of American consumers. Wal Mart's sales forecast also made the market cautious about the prospect of American consumption, especially in the current economic environment. At the same time, the latest released data has intensified concerns about the growth prospects of the US economy, especially as President Trump's policy changes may further weaken consumer spending. The above factors constitute the key reasons for the weakening of the US dollar index.
In addition, S&P Global's US February Composite Purchasing Managers' Index (PMI) fell to 50.4, lower than January's 52.7, indicating a slowdown in overall business activity expansion in the US private sector. The University of Michigan Consumer Confidence Index also fell to 64.7, a 15 month low, far below market expectations. Meanwhile, consumers' inflation expectations for the next year have risen to 4.3%. These data convey a signal of slowing economic growth in the United States and exacerbate market concerns about the Federal Reserve's monetary policy.
Nevertheless, Federal Reserve officials remain cautious about future interest rate cuts, especially in the face of ongoing inflationary pressures. Analysts believe that the Federal Reserve's attitude towards economic policy may make it difficult for dollar bears to further engage in large-scale selling operations; The market may remain cautious before the upcoming release of the US Personal Consumption Expenditures (PCE) price index.
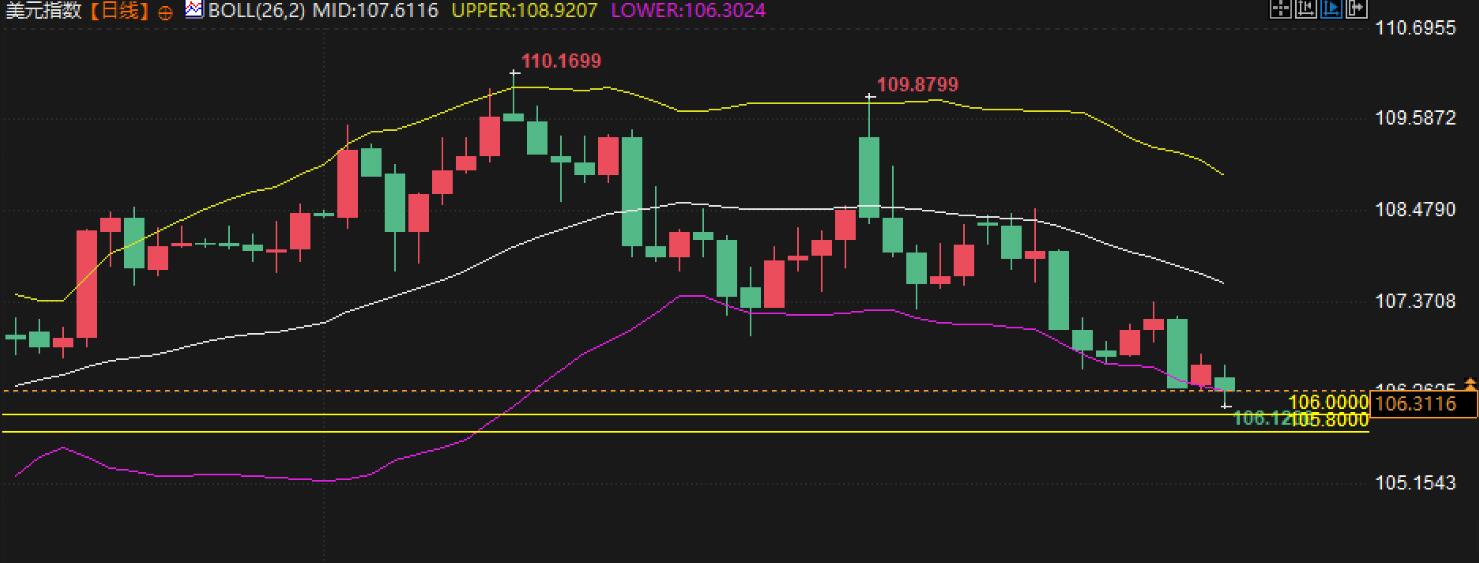
Technical analyst interpretation:
From a technical perspective, the current trend of the US dollar index reflects strong downward pressure, especially breaking through the support level of the 100 day simple moving average (SMA). The current price is around 106.30 and will face further tests below the 100 day SMA. If it falls below the current support range, the US dollar index may further decline towards the 106.00 or even 105.80 range.
From the K-line chart, it can be seen that the US dollar index has tested the 100 day SMA position multiple times in the past few days and has not successfully rebounded upwards. This indicates that the market is currently in a weak trend and there is no clear signal of a rebound in the short term. In addition, short-term moving averages (such as the 9th, 14th, and 20th) have successively fallen below the longer-term 50 day moving averages, indicating technical downward pressure on the US dollar in the short term.
In terms of MACD indicators, the current DIFF and DEA are both below the zero axis and trending downwards, indicating that the bearish market still dominates. If this bearish trend cannot be broken in the short term, the US dollar index will further decline.
From a trend line perspective, the US dollar index is currently in a relatively obvious downward channel and may continue to fluctuate along this channel in the short term. The important support is located around 106.00 and 105.80. Once these levels are breached, the US dollar will face further downside risks and may explore the 105.00 area.
Based on the Bollinger Bands indicator, the current price of the US dollar index has reached the lower limit of the Bollinger Bands, which may indicate the risk of a rebound in the short term. However, this rebound may only be a temporary correction, and the true reversal signal still needs to wait for more data support.
Conclusion:
From a technical perspective, the current downward trend of the US dollar index is still evident and may continue to face downside risks in the short term. If the price continues to break through the support level of the 100 day SMA, the US dollar index may further explore the 106.00 or even 105.80 area. At the same time, the short-term rebound risk cannot be ignored, especially when the RSI index approaches the oversold range, there may be a brief technical rebound.
Tips:This page came from Internet, which is not standing for FXCUE opinions of this website.
Statement:Contact us if the content violates the law or your rights