Gold and silver price forecast: bullish rebound after February sell-off
At the end of February, gold and silver suffered heavy losses, falling sharply below technical support. However, last Friday's price trend provided some confidence for bulls, suggesting that the previous downward trend may be nearing its end. In the past two weeks, precious metal prices have been more influenced by risk assets rather than traditional driving factors such as the US dollar and bond yields. Therefore, this week's speculative market dynamics may be more influential than traditional factors such as the US dollar index and the US treasury bond bond yield.
Are gold and silver following the trend of retail trading?
In the past ten days, the correlation between gold and silver and the US dollar index, the yield of the US 10-year treasury bond bond and the actual yield of the US 10-year treasury bond bond has shown an abnormal trend. Although they have a strong correlation with the latter two, they exhibit a trend opposite to the typical performance of non return assets.
Compared to traditional driving factors, gold and silver have recently tended to follow momentum trading markets such as Bitcoin and Nasdaq futures, exhibiting a trading style similar to that preferred by retail investors, rather than the typical trend of safe haven or cyclical assets. Although this trend may not necessarily continue, it is worth considering when analyzing market structure in the short term.
Gold: Reverse trend correction or welcome reversal?
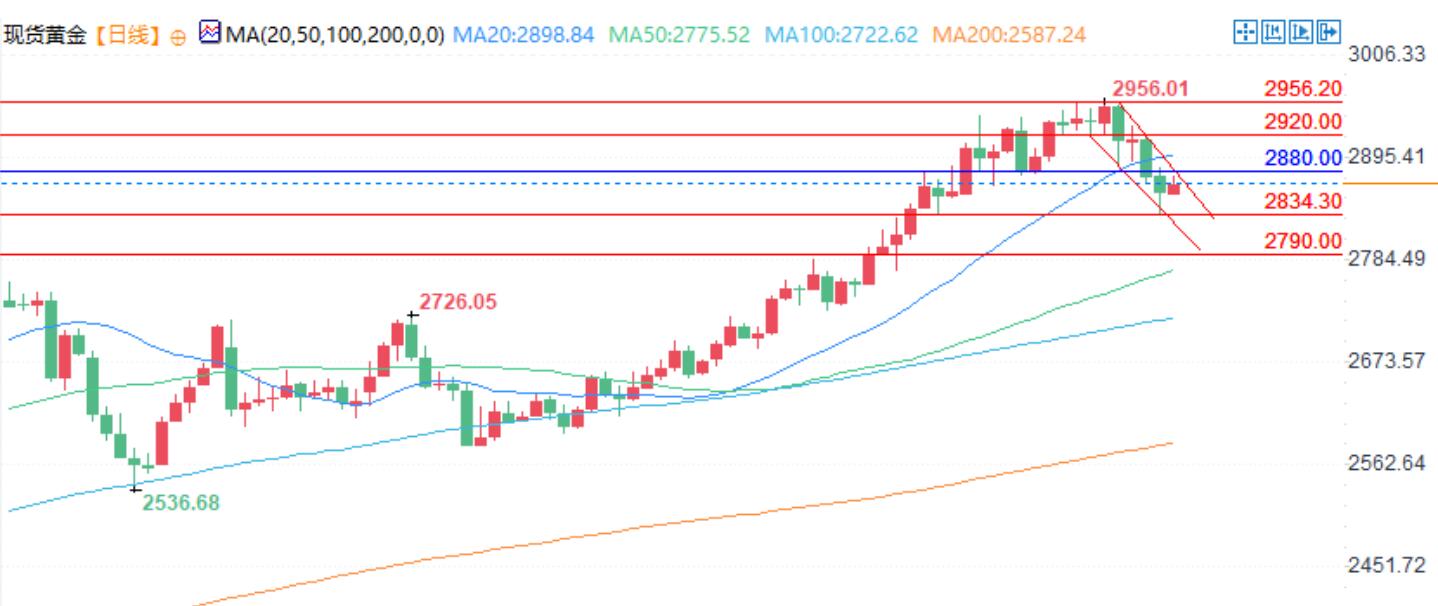
After last week's decline, gold is currently in a downward wedge shape, suggesting that it may usher in an upward breakthrough and restore the overall upward trend. Last Friday, the gold price rebounded from the support level of $2834.30, while the RSI (14) broke through the downtrend line earlier this Monday, increasing the possibility of an upward breakthrough for gold.
Key level:
The key resistance level is $2880, which has become a market focus multiple times in February. If it breaks through this level, it will confirm a bullish breakout in a wedge-shaped pattern and may explore the secondary resistance level of $2920, even challenging the historical high of $2956.20.
If the gold price fails to stabilize at $2880, it may fall back to $2834.30 and even further test the support level of $2790.
Silver rebound boosts bulls
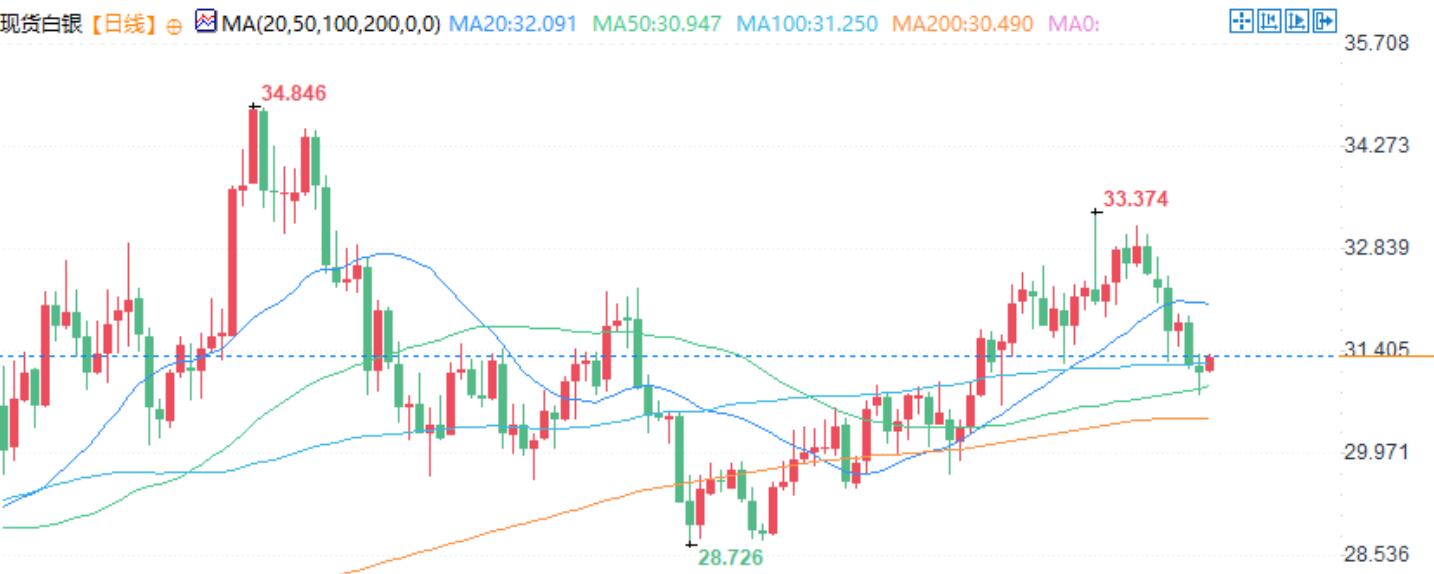
The downward wedge shape of silver may have already been completed, rebounding at the key support level of $31.00 last Friday, indicating a possible shift in market direction. This support level coincides with the 50 day moving average and the previous resistance zone, enhancing the effectiveness of the technical signal.
Although MACD has not yet given a clear bullish signal, RSI (14) has broken through last week's downtrend line, indicating an improvement in market momentum. The emergence of the hammer line pattern further strengthens the short-term bullish trend. If silver continues to rise on Monday, it may form the morning star pattern, further enhancing the expectation of upward momentum.
Key level:
Focus on $31.50, $32, $32.50, and $33 in the short term, with $31.50 potentially being the primary resistance level in the near future.
If the price falls below $31, it may weaken the bullish structure and increase the risk of a pullback.
Tips:This page came from Internet, which is not standing for FXCUE opinions of this website.
Statement:Contact us if the content violates the law or your rights