Gold, don't be deceived by the bullish candlestick too much!
In terms of gold, yesterday's strong performance in the US market exceeded expectations of volatility!
Although the early morning is not very strong, the strong cycle rhythm is still present.
The first line of 2.2884-5 did not encounter resistance and fell back, which is the 618 rebound with 2922 falling and 2834 rebounding. During the oscillation, the 618 definitely looks like a fall.
3. Daily closing with a strong sun.
Yesterday, the US market broke the similar trend with the cryptocurrency.
So let's emphasize the importance of fixed mindset!
Yesterday morning, it rose, while the European market rose but did not break the morning high. If defined as strong, the US market is definitely much lower.
To define oscillation, we must look at the 618 resistance level.
Defining trends determines operational thinking.
The same goes for today, the daily trend is bullish, it depends on whether you set the trend!
If it is defined as dominance, then the big sun will definitely follow and go long.
If defined as oscillation, this is a false bullish candlestick, and it is bound to see a secondary decline.
So, different definitions of trends represent completely different directions and points of operation.
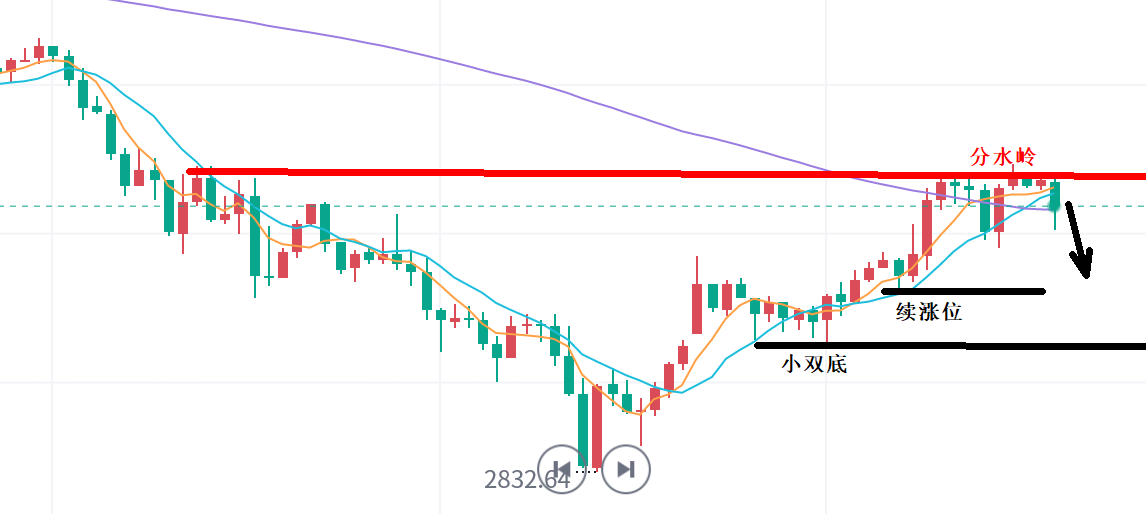
In terms of overall rhythm, this does not have the conditions for a direct strengthening and upward trend, and it is still oscillating. If it is oscillating, it means that after the daily bullish trend, it will turn negative. At the same time, yesterday's high point of 2894 is a watershed and cannot be exceeded.
At the same time, in terms of operation, it's about looking back and forth.
For this kind of unclear trend, we usually use observation method to layout the US market after the strength and weakness of the European market and watershed during the day.
Of course, defining a daily oscillation requires several points:
The overall decline and rebound of 1.2894 is at the 50% level, the high point in the early morning and early morning, which is also a sideways consolidation level. This point is the watershed of today, and as long as we see a decline, we cannot pass it, which is also an empty stop loss level.
2. The low point at 2879 in the early morning below is the first target position. If the European market breaks through, then the US market will continue its trend.
Once there is a pullback, the 618 position is at the 2857-8 line, and yesterday it started to rise twice, which is also a small double bottom.
The upward cycle in the early morning has not been broken, which means that the US stock market can explore the bottom more.
Specifically, it is more aggressive, with an early gap and a intraday break of 2895. It was withdrawn and eliminated. Look at line 2872-4 below.
A conservative approach is to wait and see during a volatile period, observing the direction of the European market's breakthrough and the US market's 618 volatility or correction.
Trading must be done in a way that one can understand, not in a game of ambiguity.
The market is not afraid of wasting time, but most afraid of wasting bullets!
Anyway, don't be deceived by Dayang today, watch and don't chase too much!
The above only represents the author's personal views and opinions. Investment carries risks, and caution is required when entering the market
Tips:This page came from Internet, which is not standing for FXCUE opinions of this website.
Statement:Contact us if the content violates the law or your rights