Gold, can increase after a pullback
The K-line is the most basic symbol of market movement, carrying the flow trajectory of money and recording the process of gains and losses of money. It has been endowed with life by people, displaying their expectations, suspicions, fantasies, greed, fears, and containing rich natural laws.
The gold price rose as scheduled in the previous trading day, and the daily chart finally closed with a slight upward shadow of the bare footed bullish line. Yesterday, gold prices surged by $38, mainly due to US President Trump's announcement that the 25% tariffs imposed on Mexico and Canada will officially take effect on Tuesday, and the planned equivalent tariffs will also be implemented on April 2nd. This measure has not only made financial markets uneasy, but also sparked widespread global attention to the new economic barriers in North America, providing safe haven support for gold prices.
From a technical perspective, the gold monthly chart shows a perfect upward trend, with prices steadily rising based on MA5, indicating that the gold price is still in a bullish trend for the long term. The weekly chart shows a bearish candlestick pattern with a bullish candlestick pattern, and the price retraces to the 5-week moving average, indicating that the medium-term upward momentum of gold prices has weakened. After hitting a historic high, the daily chart price experienced a pullback, with MA5 and MA13 forming a dead cross, but supported by the 34 day moving average, indicating that the medium-term gold price is in a downward and oscillating trend. The downward channel of gold prices since the new high on the 4-hour chart has been broken upwards, and the moving average system is moving upwards, indicating that there may be a short-term rebound in gold prices. Overall, the gold price is still on an upward trend in the long term, with an uncertain mid-term trend and an upward rebound in the short term. In terms of operation, it is necessary to grasp the rhythm of many bearish turning points.
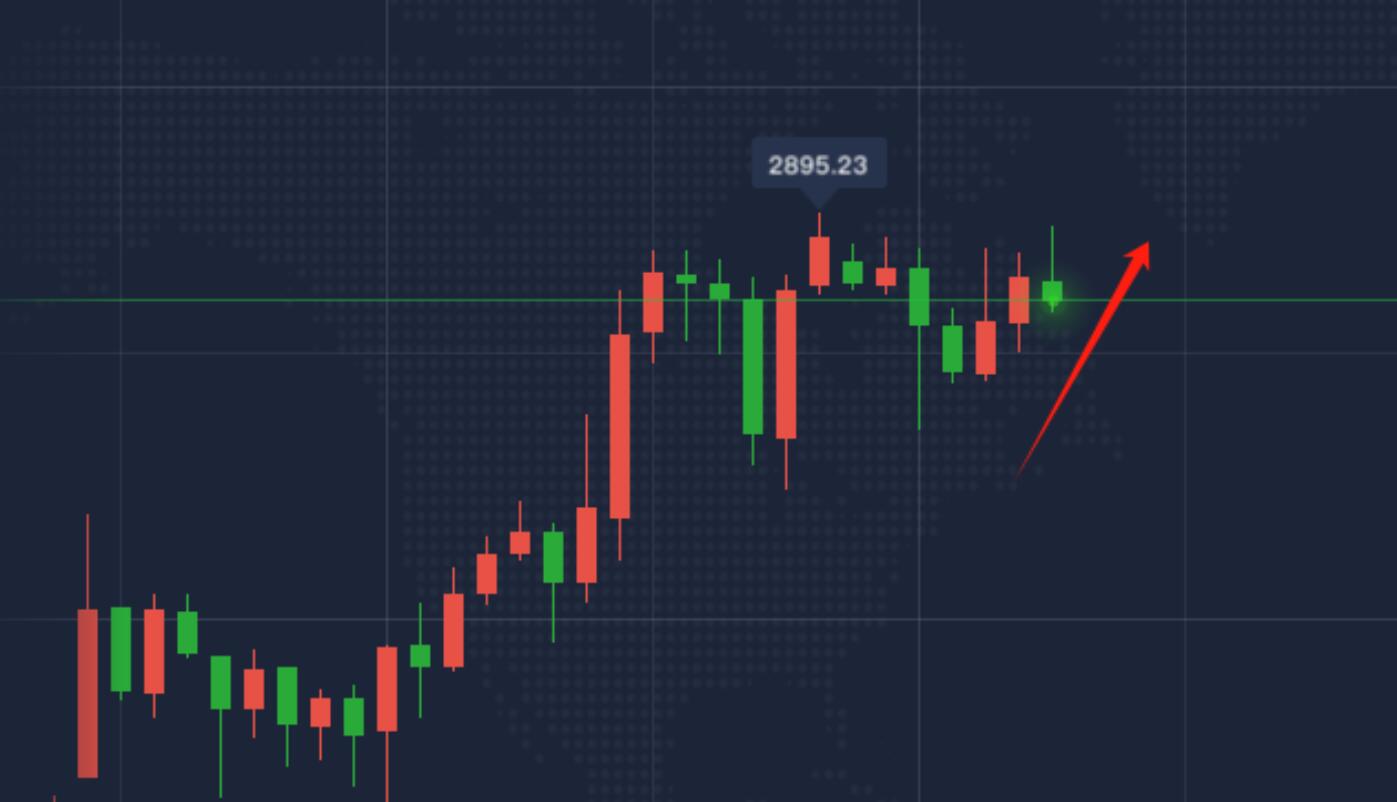
Intraday trading opportunities, pay attention to the support of the 2878-80 line below. If the hourly chart closes steadily, you can go long. The target is to continue the long position after breaking through 2890-95 and breaking through 2895.
Tips:This page came from Internet, which is not standing for FXCUE opinions of this website.
Statement:Contact us if the content violates the law or your rights