Forex trading analysis: Can USD/CHF hit bottom and rebound?
Before the European market on Thursday (March 6th), the US dollar/Swiss franc (USD/CHF) exchange rate continued its rebound from the previous trading day, rising from its lowest point of around 0.8850 since December 12th and returning to above 0.8900. However, this rebound momentum seems to lack sustained momentum, mainly due to the drag of the US dollar index (DXY) falling to a four month low.
Fundamental analysis
The current market expectation that the Federal Reserve will cut interest rates multiple times this year continues to strengthen, which has put significant downward pressure on the US dollar. The US ADP employment data released on Wednesday performed poorly, with data showing that the private sector only added 77000 jobs in February, far below market expectations, further strengthening market expectations for a Fed rate cut. The market is concerned that the US economy may face a significant slowdown, especially against the backdrop of Trump's proposed series of trade policies that could have a negative impact on the economy.
However, the significant rebound in US treasury bond bond yields has to some extent limited the further decline of the US dollar and provided some support for the US dollar/Swiss franc. Market participants are now cautiously waiting for the upcoming US non farm payroll report (NFP) on Friday, which will become an important indicator for the market to judge the direction of the Federal Reserve's monetary policy.
Technical analyst interpretation:
From a technical perspective, the US dollar/Swiss franc is currently at a critical technological turning point. The chart shows that the exchange rate is attempting to establish a short-term bottom around 0.8850.
The RSI index is currently around 39, below the neutral zone but has not yet entered the severely oversold range, indicating that although there is downward pressure, there is still room for rebound. The MACD indicator is currently -0.0022, the difference (DIFF) is -0.0036, and the DEA is -0.0024, showing a weak overall trend, but there are signs of bottoming out.
It is worth noting that the price has currently reached the psychological threshold of 0.8900, which is also close to the downward trend line on the daily chart. If we can maintain this position, the next resistance level will be 0.8964 and MA50 (0.9049). On the contrary, if 0.8900 cannot be held, then 0.8855 and lower 0.8776 may become the next support targets.
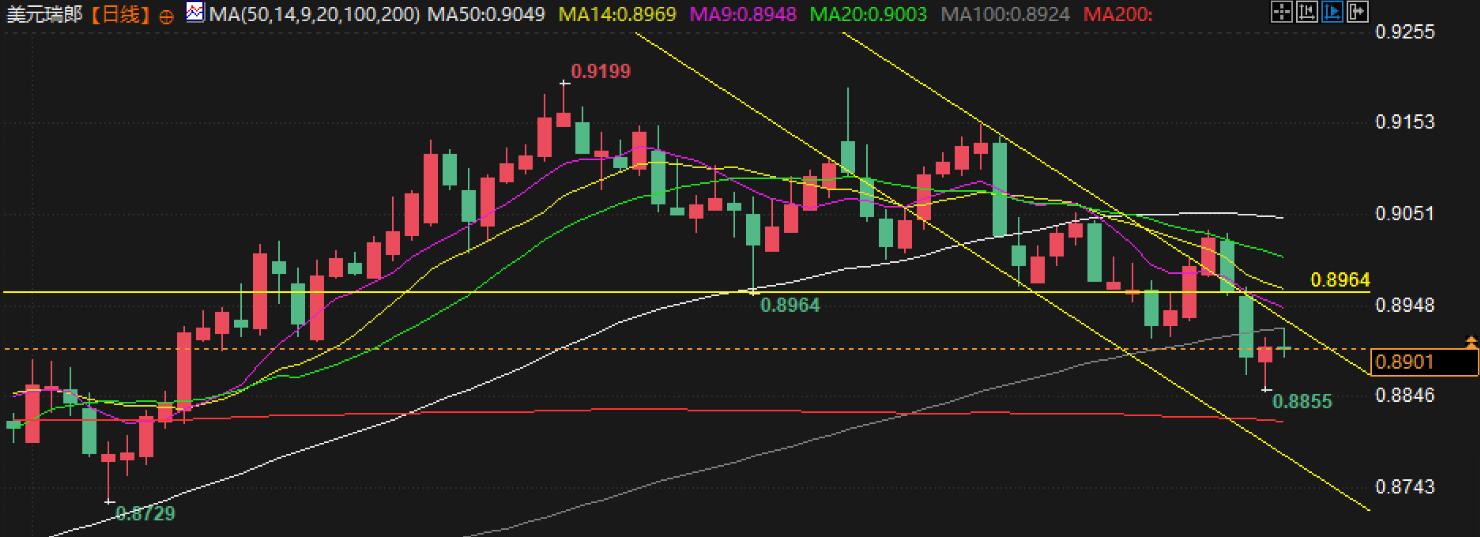
From the candlestick pattern, a series of descending highs and lows have recently formed, indicating that the overall trend is still bearish. But the recent two trading days' bullish rebound suggests that bearish forces may be weakening, and the market is expected to form a short-term reversal. The current price has fallen by about 3.2% from the previous high of 0.9199, approaching the technical oversold zone.
Observing whether the 0.8900 level can become effective support will determine whether to continue the decline or initiate a rebound in the short term.
Given the upcoming release of US non farm payroll data on Friday, the market is currently cautious. If the data falls short of expectations, the USD/CHF may retest at 0.8850 or even lower levels; But if the data is better than expected, there may be a rebound towards the range of 0.8950-0.9000.
The downward trend of the US dollar/Swiss franc over the past few months has been quite evident, and the chart from December 2024 to present shows that the price has continued to decline from the high point of 0.9199. Although there may be a technical rebound in the short term, to confirm a mid-term trend reversal, it is necessary for prices to re stand at the MA50 and MA100 moving averages.
Tips:This page came from Internet, which is not standing for FXCUE opinions of this website.
Statement:Contact us if the content violates the law or your rights