Forex Trading Analysis: Long positions collapse, AUD/USD hits new low
On Monday (April 7th) during the Asian session, the Australian dollar/US dollar exchange rate experienced a sharp decline, falling to the level of 0.5932 at one point, hitting a new low in recent years. The exchange rate fell below multiple key technical support levels, triggering panic selling in the market.
The data released by the US Department of Labor last Friday showed that non farm payroll employment increased by 228000 in March, far exceeding the revised February increase of 117000, indicating that the US job market remains strong. Meanwhile, the unemployment rate rose slightly to 4.2%, higher than the previous 4.1% and market expectations. Despite the good performance of employment data, the market still expects the Federal Reserve to make multiple interest rate cuts this year. Currently, the market has priced in the cumulative 100 basis points of interest rate cuts for the whole year, and the possibility of a fifth interest rate cut cannot be ruled out.
However, due to the direct impact of US tariff policies, the Australian dollar, as a commodity currency, is under tremendous selling pressure.
Technical analyst interpretation:
From the 120 minute chart analysis, the price trend of AUD/USD shows a clear trend turning signal. The consolidation range formed by the exchange rate since March has been completely broken through, forming a typical pattern of breaking through and falling. The three track system of the Bollinger Bands shows that the exchange rate not only fell below the middle track (supported by the moving average), but also directly fell below the lower track, triggering panic selling. Such breakthroughs usually indicate a change in the medium-term trend, implying that the action can be strong.
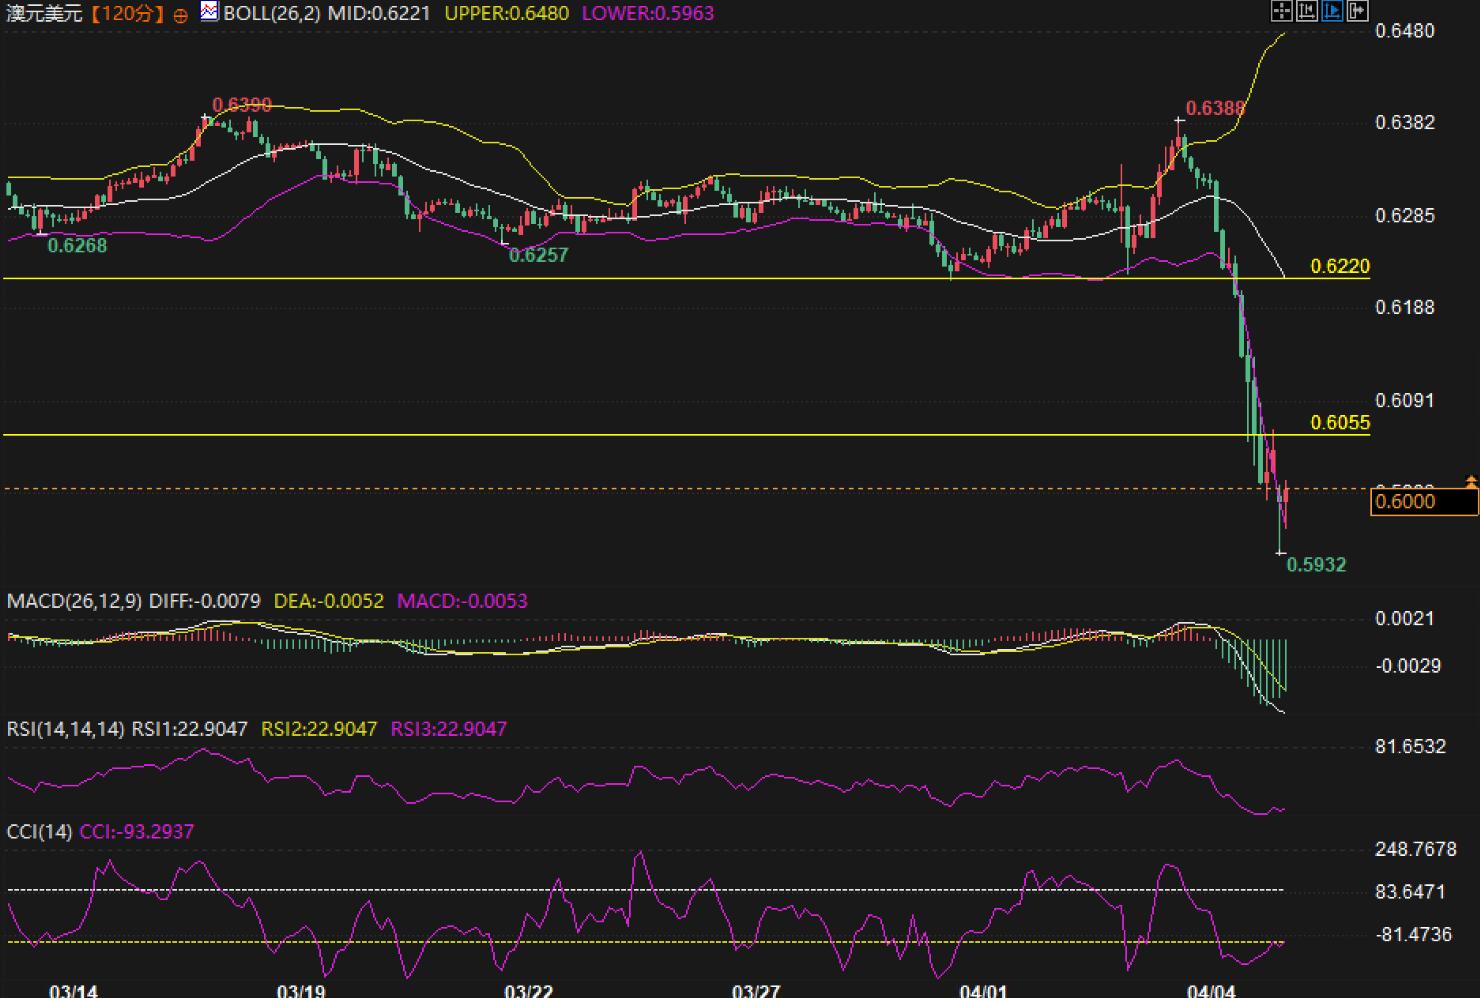 The MACD indicator shows a clear bearish trend, with the bar chart rapidly turning negative and continuously expanding. Both the DIFF and DEA lines have turned negative, indicating significant downward pressure in the short term. At the same time, the RSI index has fallen to the level of 22.90, entering a severely oversold area. However, in the strong downward trend, the oversold state may continue, and price rebound should be treated with caution.
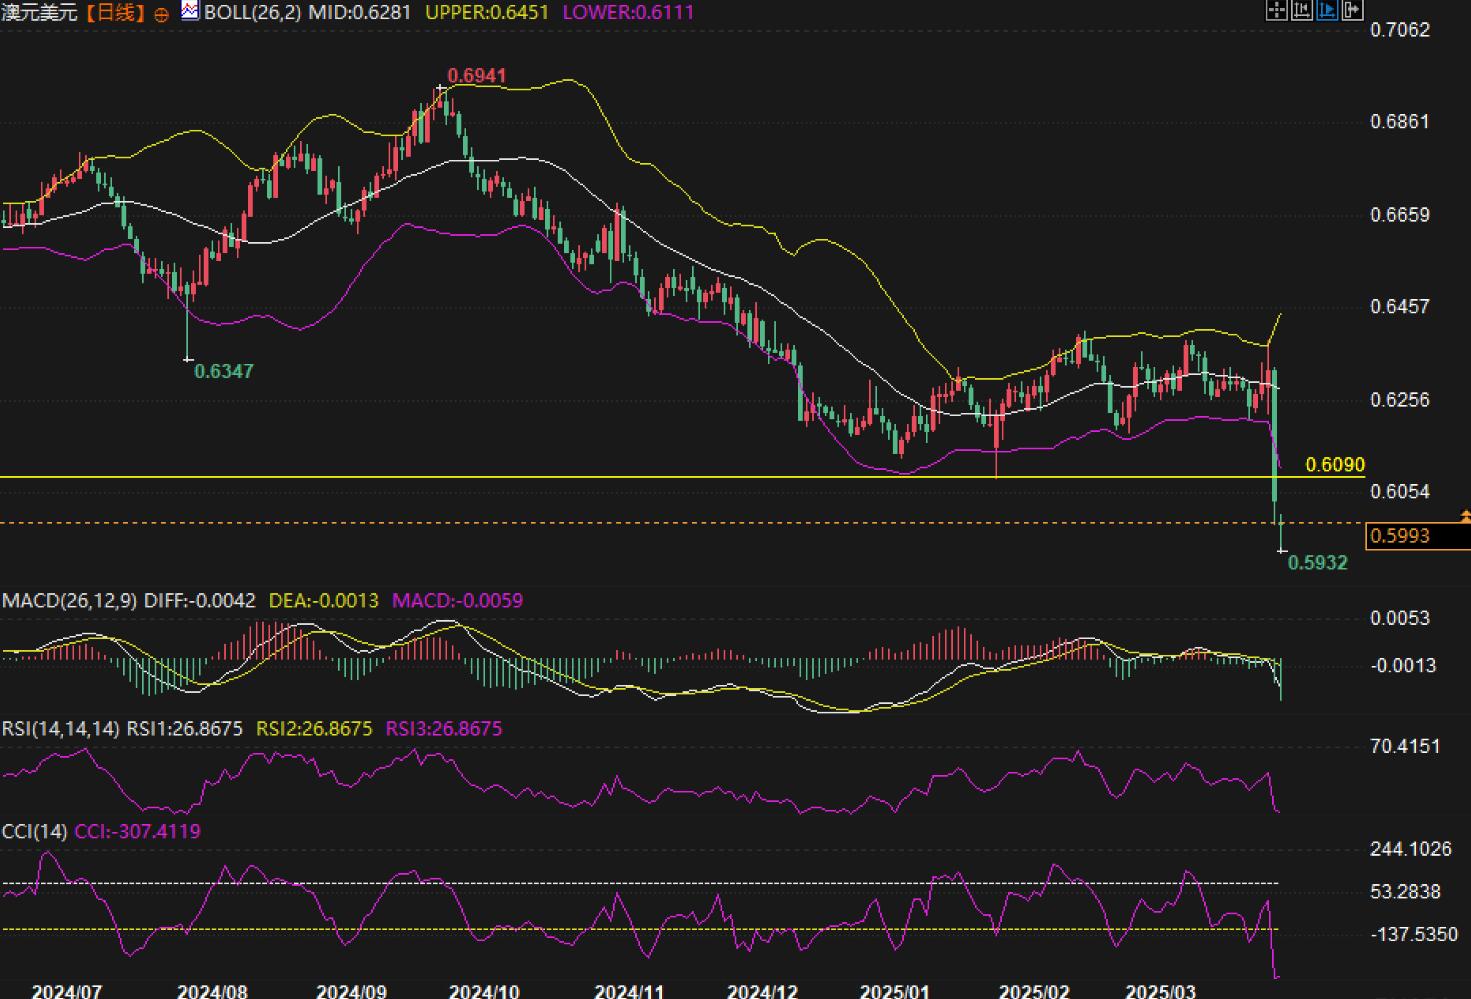
Daily chart analysis shows that the downward trend starting from September 2024 has accelerated. The exchange rate has recently shown a large bearish candlestick, with significantly increased trading volume. This downward trend of volume price coordination indicates that the bearish dominance may continue. It is worth noting that the key support level of 0.6090 was quickly broken through, indicating an extremely pessimistic market sentiment. The CCI index fell to the extremely oversold range of -307.41, hitting a new low, reflecting the current strong selling pressure.
Future prospects
Short outlook: From a technical perspective, the Australian dollar/US dollar may test the support of the 0.5900 integer level. If this level falls, the next target level will look towards the 0.5850 and 0.5800 regions. The continuously expanding negative bar chart of MACD indicates that downward momentum remains strong in the short term. At the same time, the opening of the Bollinger Bands diverges downwards, indicating that volatility will further expand, which is conducive to bearish performance.
Long outlook: Although the technical outlook is extremely pessimistic in the short term, from a reverse thinking perspective, the oversold level of RSI and CCI indicators has reached its limit, which may trigger a technical rebound. If the exchange rate can stabilize above the psychological level of 0.6000, it may trigger short covering and push the price to rebound towards the levels of 0.6055 (previous support turning into resistance) and 0.6220 (middle Bollinger Bands).
In the long run, the Australian dollar/US dollar is currently near an important historical support zone. If it can return above 0.6300 in the coming weeks, it will mark the completion of a double bottom pattern and open up upward space for the exchange rate. However, if it quickly falls below 0.5900, it means that a new downward cycle has officially begun, and traders will pay attention to the policy response of the Reserve Bank of Australia and the trend of international commodity prices.
Tips:This page came from Internet, which is not standing for FXCUE opinions of this website.
Statement:Contact us if the content violates the law or your rights