Market forecast for non farm payrolls in July is disappointing, which may push gold prices to a high of $2483!
On Friday, August 2nd at 20:30, the United States will release its non farm payroll report for July. This employment report will not be the last report before the September FOMC policy meeting, but it will be the first report for the third quarter and second half of the year. Therefore, these data may have symbolic significance, especially after the Federal Reserve decided to put the September rate cut on the table, but did not provide information on whether further rate cuts would occur after the November presidential election.
The forecast for non farm payroll in July is disappointing
The market expects non farm payroll to increase by 175000 in July, lower than the previous value of 206000. Goldman Sachs economists predict that employment data will be weaker than commonly expected. They expect to add 165000 job positions in July.
Chris Lau, the head of the SA investment team for DIY Value Investment, predicts that non farm employment will only increase by about 120000 in July, driven by the growth of healthcare and government sector jobs.
The Bank of Baden-W ü rttemberg in Germany has the lowest expectation at only 70000, while Bank of America has the highest expectation at 225000. The non farm payroll for June was 206000, slightly higher than the expected 190000.
According to market consensus, the non farm payroll of private enterprises in the United States changed to 148000 in July, slightly higher than the previous value of 136000. The unemployment rate remained at 4.1% in July.
The labor force participation rate in the United States is expected to be 62.6% in July, and the U6 unemployment rate in July is 7.4%, both consistent with previous values.
It is expected that the average annual hourly wage rate in the United States in July will be 3.7%, slightly lower than the previous value of 3.9%. The average monthly hourly wage rate in July was 0.3%, the same as before. The average weekly working hours in the United States in July were 34.3 hours, the same as before.
Previously released data showed that the number of initial jobless claims in the United States for the week ending July 27th was 249000, slightly higher than the previous value of 235000. This data is the highest since August 2023. However, these numbers may be distorted by Hurricane Belle; However, this storm may also affect the non farm payroll report.
The September interest rate cut is a foregone conclusion, what is the next step?
In summary, a 25 basis point rate cut by the Federal Reserve in September is a certainty, and a small group of investors expect a larger 50 basis point rate cut. Perhaps, unless the employment data deteriorates sharply and the inflation rate drops to the Federal Reserve's target of 2.0%, bold double rate cuts may still be unfavorable.
Meanwhile, if the non farm payroll report falls short of expectations, including a slowdown in wage growth and/or a slight increase in unemployment rate again, it may increase the prospect of a second interest rate cut in the coming months. The futures market shows a 60% chance of the Federal Reserve cutting interest rates by 25 basis points in November, and investors are confident that there may be another rate cut in December.
Market reactions that may be triggered by non-agricultural data
As for the market reaction, if the non farm payroll data in July really disappoints, the US dollar may further fall, pushing gold prices close to the historical high of $2483, and even approaching the psychological level of $2500. The $2550 restricted zone may be the next target.
In the opposite scenario, with non farm employment once again exceeding 200000 and wage growth showing some strength, investors may lower their expectations for a 50 basis point rate cut in September and may lose confidence in a second rate cut in the coming months. Therefore, the US dollar may attract new buying interest, pushing the gold price down to $2385 to $2410. If the gold price falls below the 50 day moving average, it may raise concerns about a reversal of the bearish trend, leading to an accelerated decline towards the $2320 area.
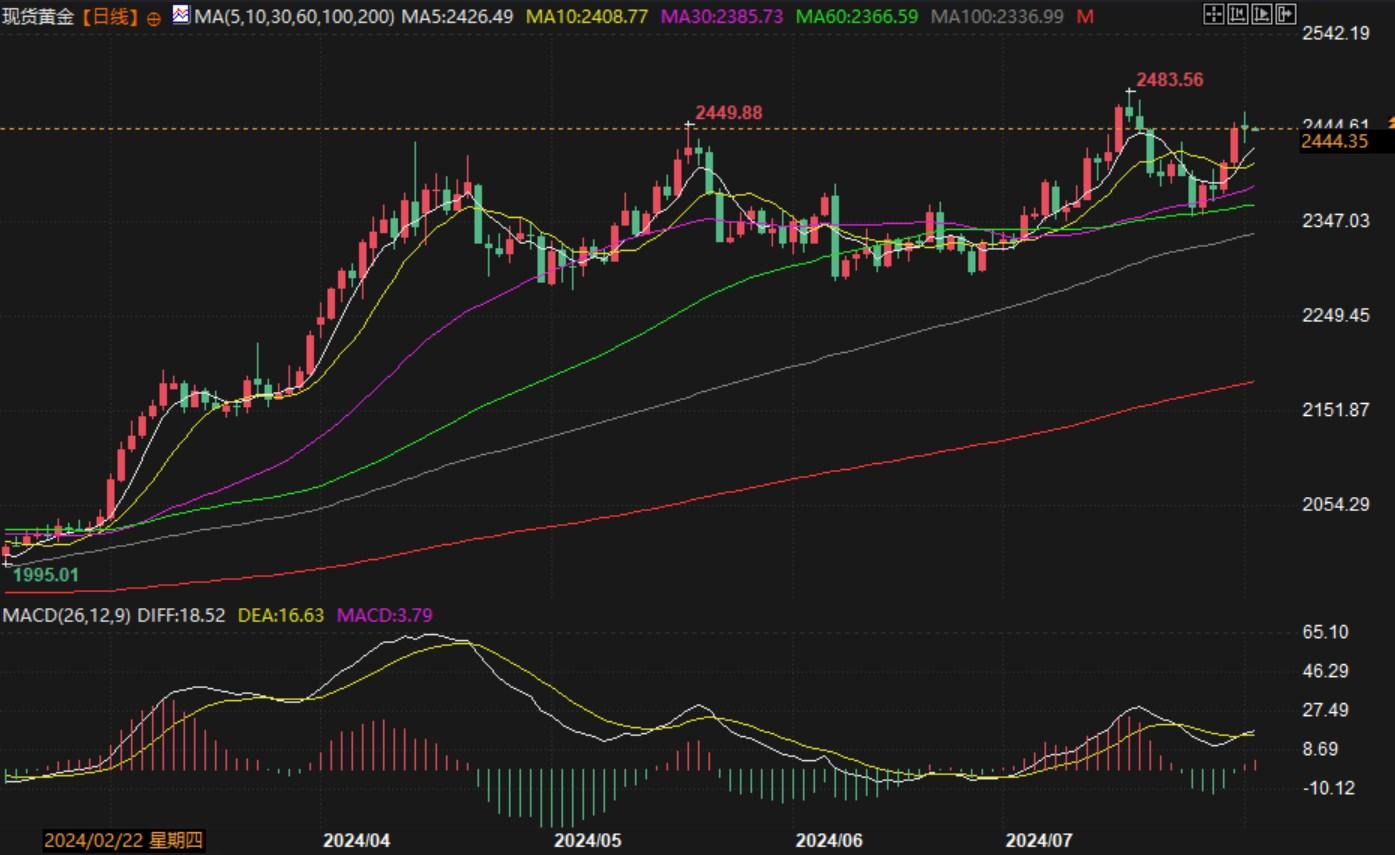
Daily chart of spot gold
Tips:This page came from Internet, which is not standing for FXCUE opinions of this website.
Statement:Contact us if the content violates the law or your rights