Gold targets key upward breakthrough, investors wait for US inflation data
On Wednesday (August 14th), gold prices slightly declined as investors remained on the sidelines ahead of the release of US inflation data later today, which could set the tone for the Federal Reserve's September policy meeting.
Spot gold rose 0.36% during trading to $2473.61 per ounce. Last month, the price hit a historic high of $2483.60.
The US Consumer Price Index data for July will be released at 20:30 Beijing time, and is expected to show an acceleration of the month over month inflation rate to 0.2% and a slowdown of the annual core inflation rate to 3.2%. Retail sales data is scheduled to be released on Thursday.
Kyle Roda, a financial market analyst at Capital website, said that if the CPI data does not match the expected interest rate cut, gold may fall to $2300, but in the long run, as the US economy weakens enough for the Federal Reserve to significantly cut interest rates, gold may rise.
Tuesday's data showed that the US producer price increase in July was lower than expected, reinforcing market views that cooling inflation will prompt the Federal Reserve to cut interest rates soon.
According to the CME FedWatch tool, traders expect a 54% chance of a 50 basis point rate cut in the United States in September.
Atlanta Federal Reserve Bank President Rafael Bostic said he wants to see "a little more data" before he is prepared to support lowering interest rates.
Gold, which is typically used to hedge geopolitical risks, performs strongly when interest rates are low.
technical analysis

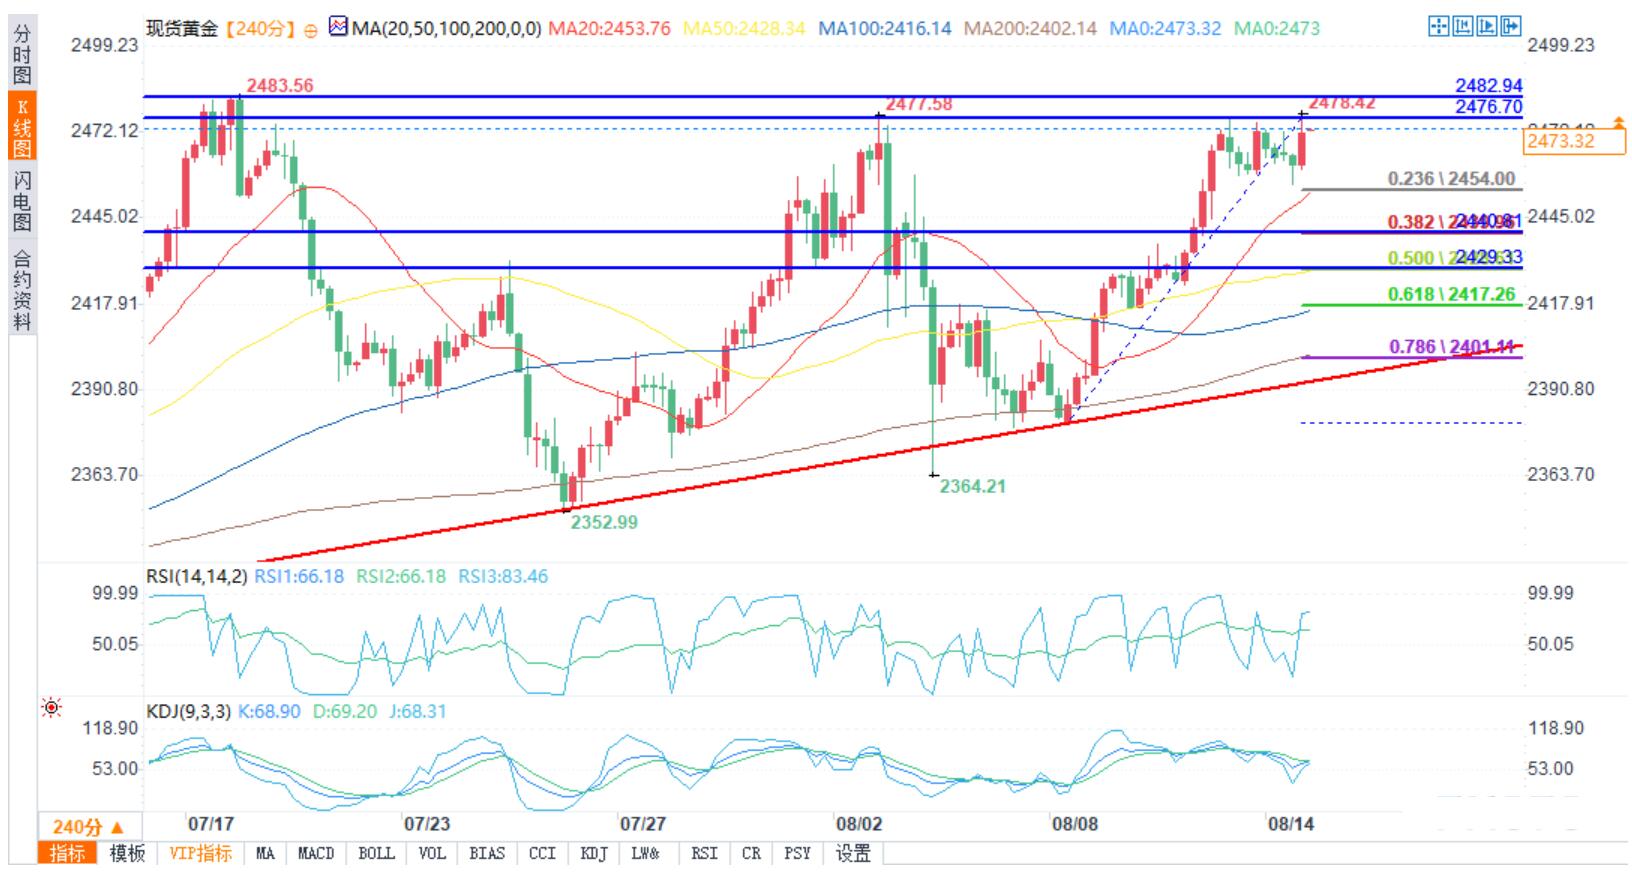
4-hour chart of spot gold
Gold prices have found support around $2380. The price has formed a short-term bottom and recently started to rise above $2420.
The 4-hour chart of spot gold shows that the price is at the level of $2440, settled above the 100 and 200 simple moving averages. Even broke through the resistance level of $2465 upwards.
Finally, the bears appeared around $2475. At present, the gold price is consolidating and is expected to further rise. The direct resistance level is around $2475.
The first major resistance level is around $2485. If the price significantly rises above the resistance level of $2485, it may open up more upward space. The next major resistance level may be around $2500, above which the price may accelerate towards the level of $2520. Any further increase could push gold towards the resistance level of $2550.
On the downside side, a key support level has formed around $2440. The current main support level is around $2400. On the same chart, the support level of $2400 also forms a major bullish trend line.
Breaking below the support level of $2400 may bring more downward space. The next major support level is around $2380. If the gold price continues to decline, it may fall towards $2365.
Today's economic data is worth paying attention to
The US July 2024 Consumer Price Index (MoM) - forecast+0.2%, with a previous value of -0.1%.
The US Consumer Price Index for July 2024 (YoY) - forecast+2.9%, previous value+3%.
The US Consumer Price Index (CPI) for July 2024, excluding food and energy, is predicted to be+3.2% year-on-year, compared to the previous value of+3.3%.
Tips:This page came from Internet, which is not standing for FXCUE opinions of this website.
Statement:Contact us if the content violates the law or your rights
