USD/JPY daily chart analysis
On Thursday (August 15th) during the European trading session, the USD/JPY experienced a V-shaped reversal after hitting a low of 147.049, and closed at 147.359, an increase of 0.02%.
Historical trends suggest weak US economic data
After being dominated by the latest inflation data earlier this week, today's focus returns to US economic activity. Specifically, it refers to the retail sales in July and the weekly number of people applying for unemployment benefits. Economists say that the retail sales of the control group are expected to increase by 0.1%, with the number of applicants slightly rising to 235000.
Look at the number of people who have applied for unemployment benefits in the past month. It's like a yo yo, dramatically moving from one week to the next. If this pattern continues, we may see another significant increase today.
A moderate increase in control group retail sales (directly included in the calculation of US GDP) is by no means inevitable, as there have been three consecutive months of growth not seen since 2018, indicating that we may see negative growth later today.
If these patterns continue (with a focus on 'if'), temporarily eased recession concerns may resurface, leading to a renewed weakness in the risk asset class. Although inferring data trends to form specific views on the economy is risky, this is exactly what the market did in August, combined with sluggish trading volumes, resulting in extreme two-way fluctuations.
Weak data may cause US two-year treasury bond bond yields to retest recent lows
If we see that both the number of jobless claims and retail sales trigger new economic concerns, the market may begin to absorb the risk of the Federal Reserve cutting interest rates by 50 basis points in September, thus generating the risk that the yield of two-year US treasury bond bonds may fall back to the low point hit during the market panic at the beginning of last week.
As has been widely reported in the past few weeks, when concerns about the US economy lead to a sharp decline in the yield of US treasury bond bonds, the dollar/yen tends to move in the same direction.
The US dollar against the Japanese yen looks heavy
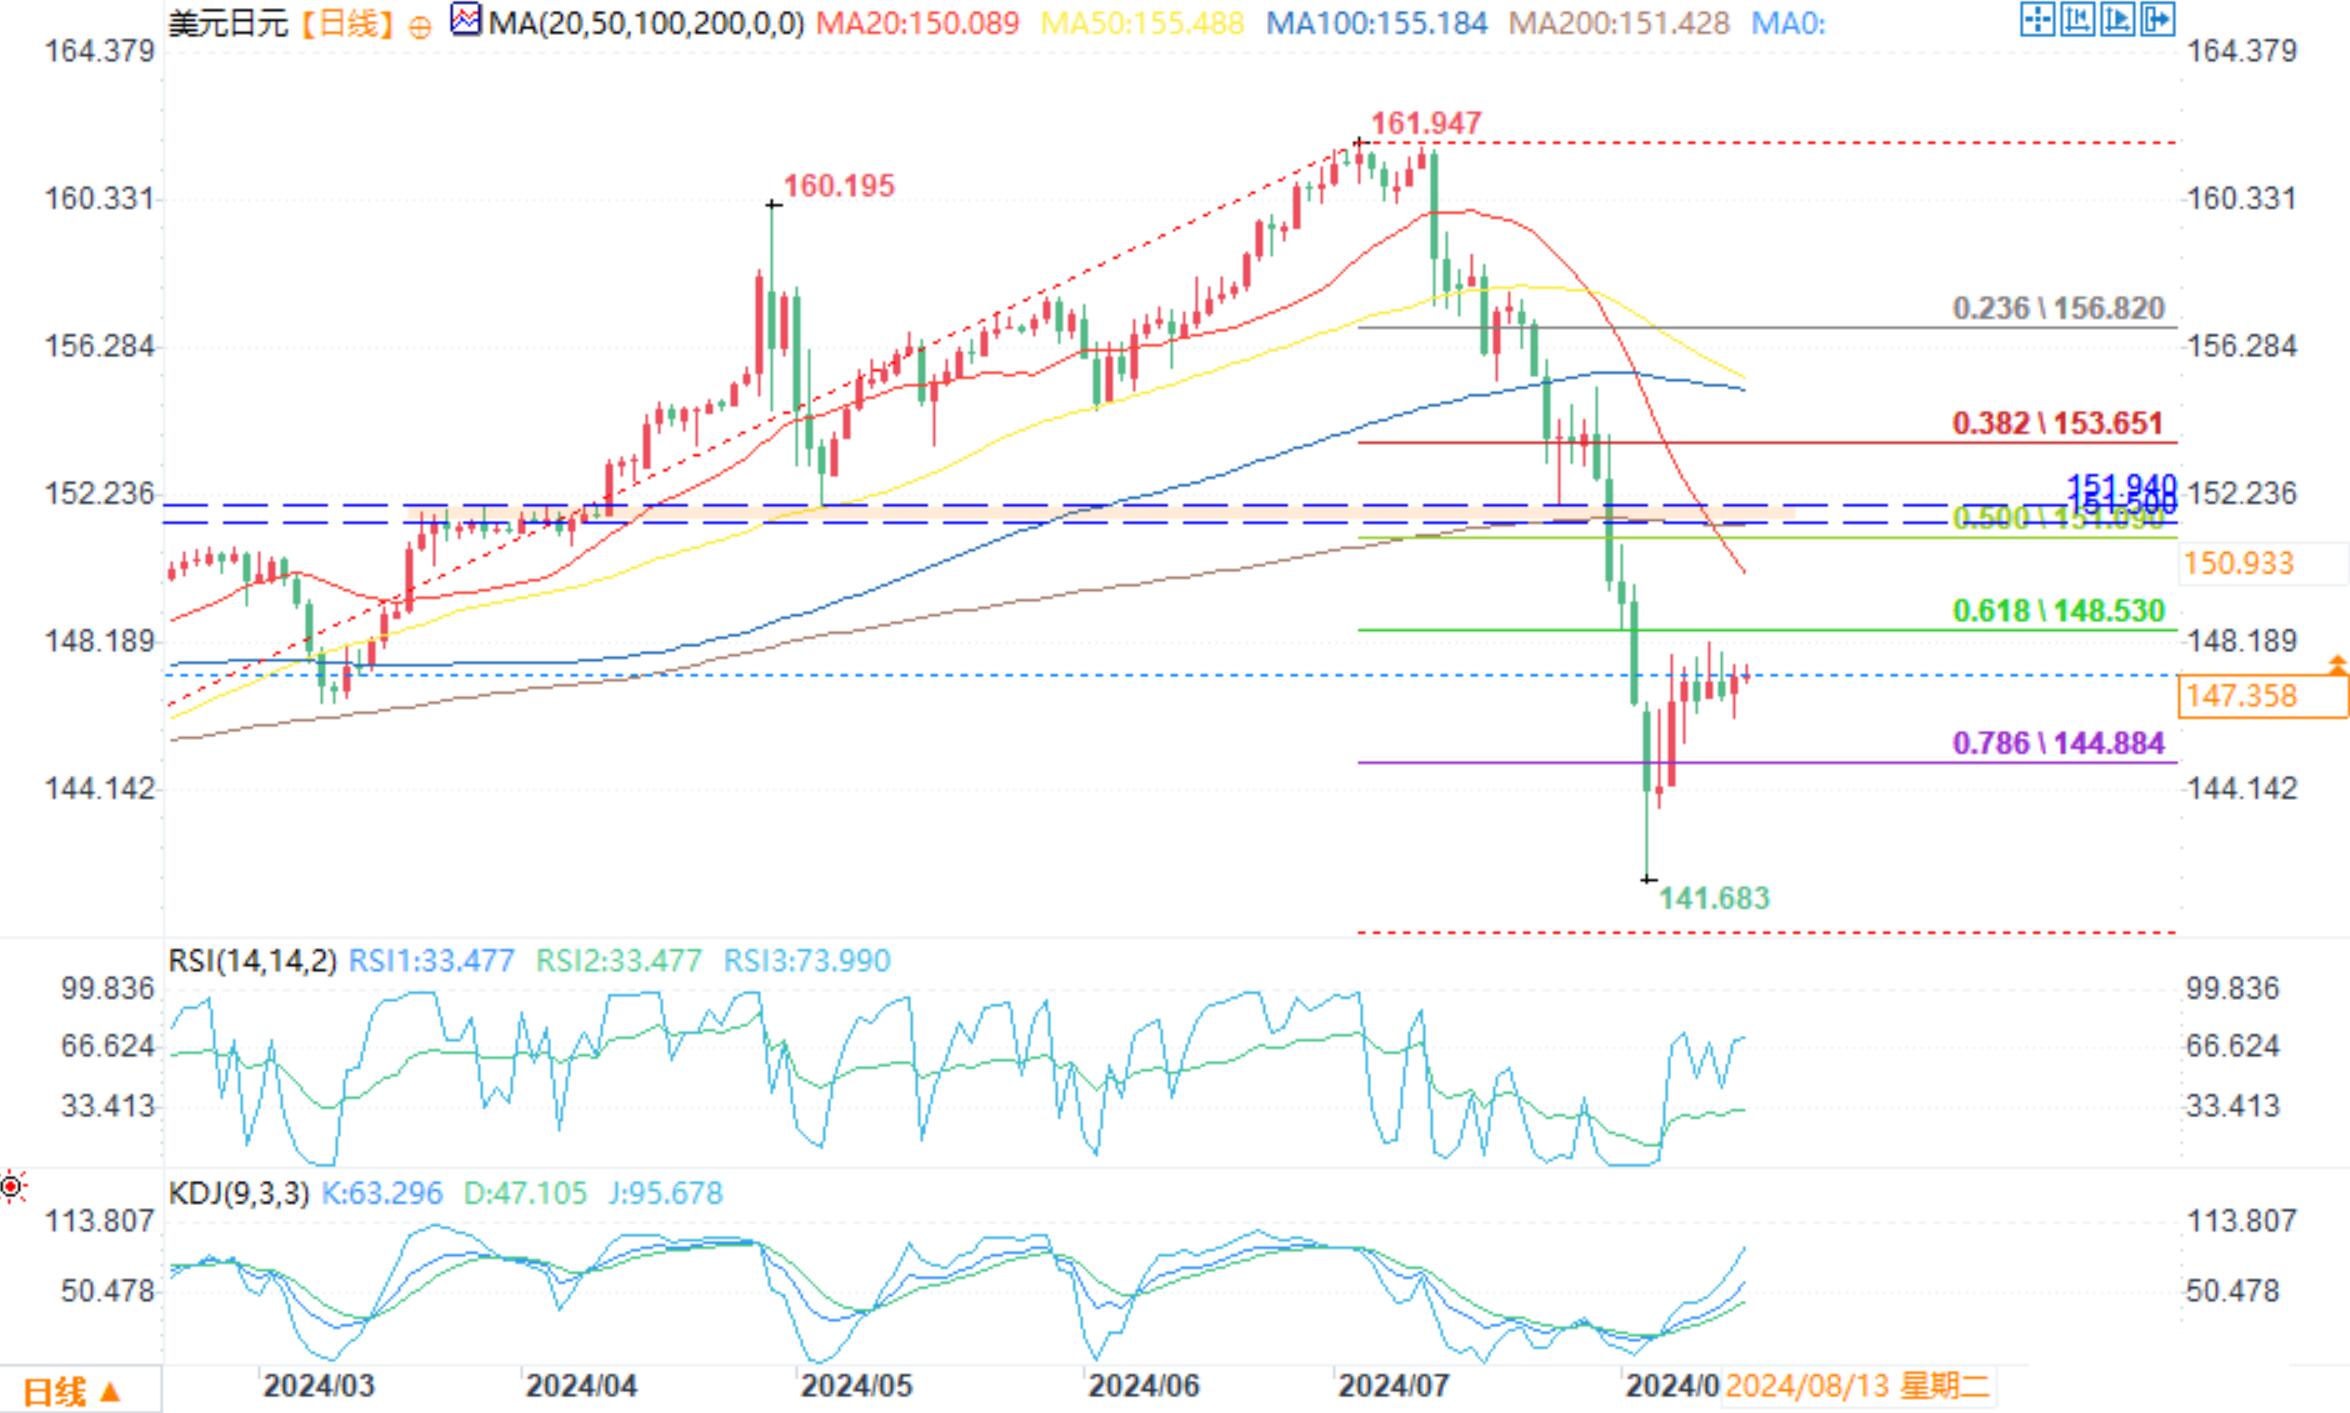
USD/JPY daily chart
Although there has been a rebound in the past week, it is worth noting that the US dollar has been unable to recover its upward trend against the Japanese yen since early 2023, attracting a buying price below 146.50 but unable to push it above 148.00. Visually, this seems heavy. If we see the yield of US treasury bond bonds fall again, who dares to say that the arbitrage trade may not start to close positions again? If this situation really occurs, it is easy to see the low point touched last week reappear.
Of course, such a result may require weak data from the United States first. If not, this ticket is basically invalid. This is an important moment that may calm concerns about an economic recession or significantly exacerbate them.
Tips:This page came from Internet, which is not standing for FXCUE opinions of this website.
Statement:Contact us if the content violates the law or your rights