Gold breaks through and overbought, grasping a lot of bearish rhythm
Last week (week 0812-0816), gold prices rose 3.13% to $2506.96 per ounce, marking the largest weekly increase in four and a half months (since early April). Over the course of five days, two large bullish lines at one end and one tail, combined with a small consolidation trend in the middle, ultimately pushed the market higher by over $80. The gold price broke through the original historical high of 2483.56 and reached a new historical high of $2509.59 per ounce.
Let's take a look back (if you're not interested in this paragraph, you can skip it). As reminded in our article before the opening on August 12th, the US CPI and retail prices during this period have had a significant impact on the Federal Reserve's interest rate cut expectations and have fueled the gold price. Iran's retaliatory actions against Israel and Ukraine's occupation of Russia's mainland territory have also boosted the gold price. However, the expectation that the gold price would likely be blocked at 2458 fell short, but there was a reminder at that time that "once it breaks through 2458, it will look up to 2478 and 2483 in turn, and may rise to the 2495-2500 area at most, and then fall sharply". This prediction is roughly accurate, and the actual market situation is that the gold price has been blocked multiple times near 2478 and fell sharply, with a low of 2432 line, followed by long and short. A tug of war was conducted between 2432 and 2370, and ultimately the bulls stabilized around 2450, Afterwards, it opened an open-ended uptrend of nearly $60 to a new historical high, during which the gold price plummeted by $23 to around $2477 within half an hour when it reached $2500.
As the expectation of the Federal Reserve's interest rate cut in September has become the anchor of the market, the quality of data is only based on this expectation to weaken and strengthen expectations. Overall, the upward trend of gold has been established since the high-level adjustment mode in late April, and breaking through the level is only a matter of timing. And on August 16th, there was a breakthrough rise.
As shown in the figure below, the gold daily chart broke through the top diagonal pressure level (pink line), exceeding the pressure line by about $15, and closed above it almost at the bald bullish line. Even on the weekend, it did not cause the bulls to withdraw, which shows that the confidence of the bulls is bursting. The gold price may continue to rise in the new week, but it should be noted that there are signs of divergence between MACD and KDJ high levels in multiple cycles such as daily and 4-hour charts, and the price may need to retrace to support after breaking through.
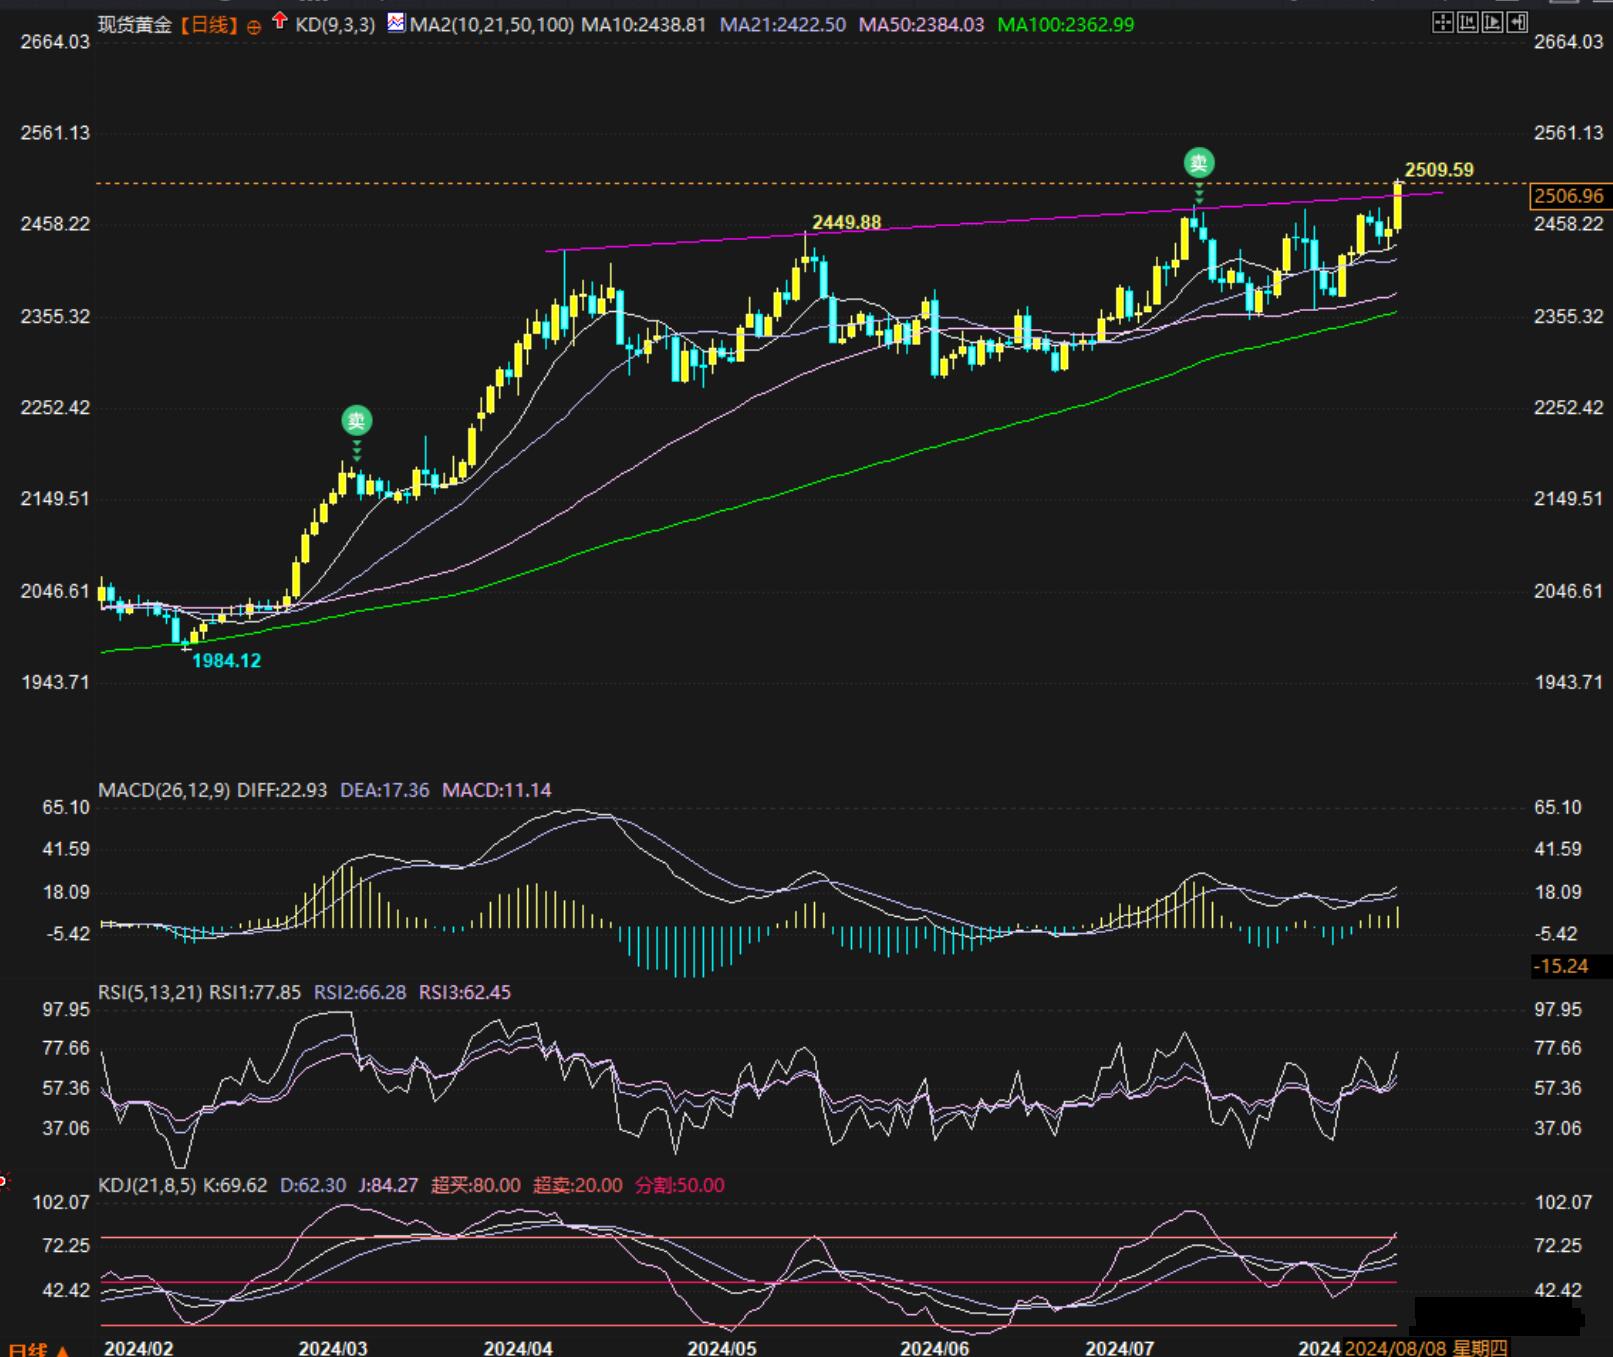
Technical analysis of spot gold daily chart
Therefore, this week (0819-0823), gold is still dominated by bulls, but after a sharp rise, it is necessary to be cautious about chasing higher prices and choose to go long when stepping back on support or a more cautious approach. Support sequentially focusing on areas 2498-2500, 2495-2492, and 2478. Due to multiple obstacles in the gold price around 2478, this also means that 2478 will be a strong support for the gold price. But if lost, follow 2460, 2450, 2438, and 2430 below in order. The key targets may be 2478 and 2450.
When the gold price rebounds and stabilizes, the support for the gold price will turn upward again, and the above support will become resistance. In addition to paying attention to 2509 (the current historical high), attention should also be paid to 2518, 2530, 2550, 2554, and 2568, which are the 87.5% extension level, 100% extension level, psychological level, 123.6% extension level, and 138.2% extension level of 2380-247-2432 on the 4-hour chart since the morning of August 8th. We can see that the closing price of gold on August 16th was at the 75% expansion level. For more resistance, please refer to the 4H chart below.
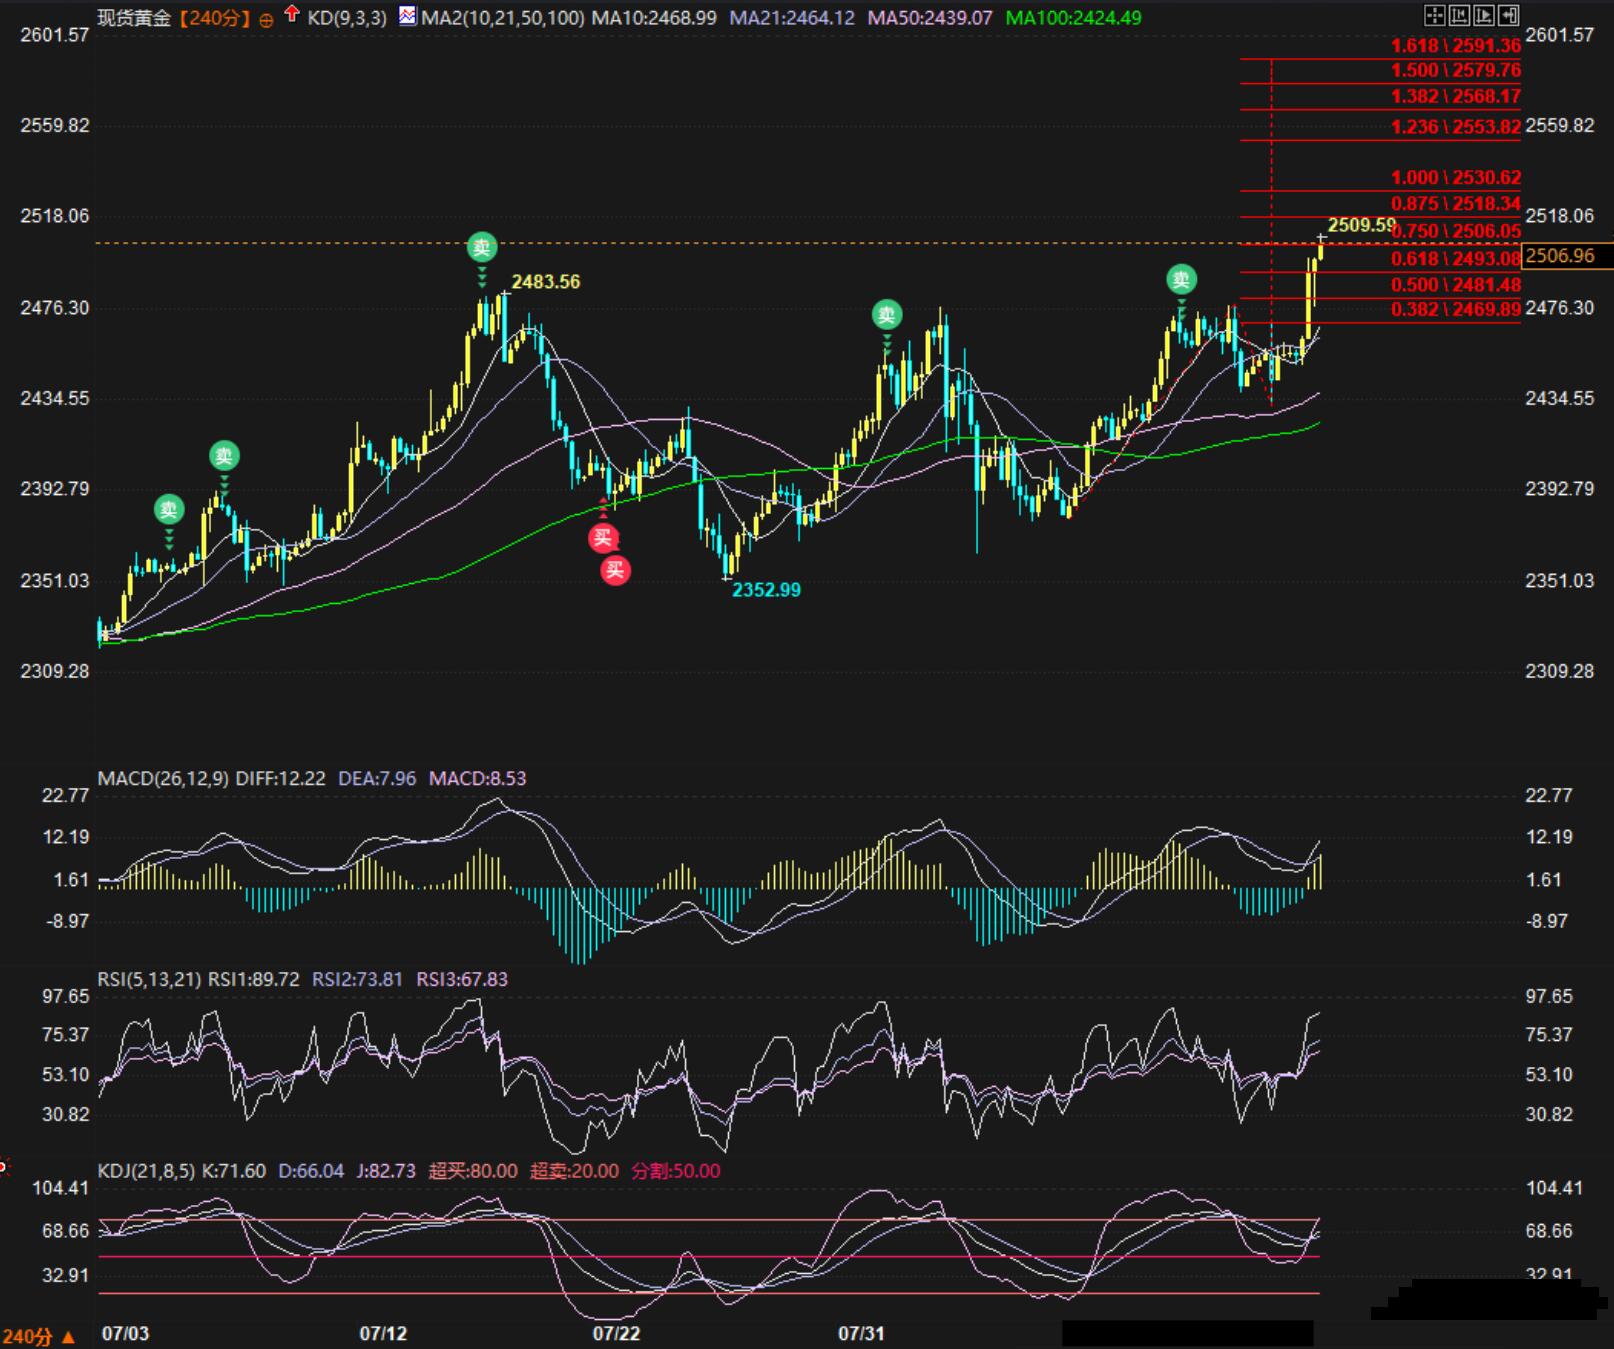
4-hour technical analysis of spot gold
Fundamental news, in addition to continuing to pay attention to the geopolitical situation, the highlight of this week will be the second half: at 01:35 on August 21, 2024, FOMC voting committee member and Atlanta Fed Chairman Bostic delivered a speech; at 02:00 on August 22, there will be minutes of the Fed meeting; and on August 22, the "Jackson Hole Global Central Bank Annual Meeting" (three days) will begin local time in the United States. Among them, at 22:00 on August 23, Fed Chairman Powell delivered a speech on the economic outlook at the Jackson Hole seminar. In addition, on August 23rd at 08:30, Bank of Japan Governor Kazuo Ueda and Japanese Finance Minister Toshiichi Suzuki attended a parliamentary hearing - their remarks may be closely monitored by the market due to the recent interest rate hike by the Bank of Japan, which has caused a major disturbance in the financial market.
Tips:This page came from Internet, which is not standing for FXCUE opinions of this website.
Statement:Contact us if the content violates the law or your rights