Silver has fallen, but the technical outlook remains bullish! If it breaks through $31, it will prolong the upward trend
Earlier this week, spot silver hit a January high of $31.08 before falling back and currently trading at around $30.40. However, there is a possibility of buying on dips in the technical aspect.
Market analyst Haresh Menghani stated that silver has recently broken through the short-term downward trend line resistance of around $29.40, as well as the 100 day moving average, validating the positive outlook in the short term. In addition, the oscillation indicators on the daily chart are still in the positive zone and far from reaching the overbought zone, indicating that the minimum resistance path of silver prices is upward.
From the current level, any subsequent decline could attract buyers approaching the psychological level of $30. This should help limit the downward space below $29.40. If it falls below the support of $29.40, silver prices will fall below $29 and further towards the $28.45-28.40 range, as well as $28.
On the other hand, the resistance level of silver prices is located in the $30.80 area, as well as $31. If it can break through $31, silver prices may prolong their upward trend and subsequently climb to the $31.45 area, retesting the July high of $31.73 and challenging the ten-year high of $32.49 reached in May.
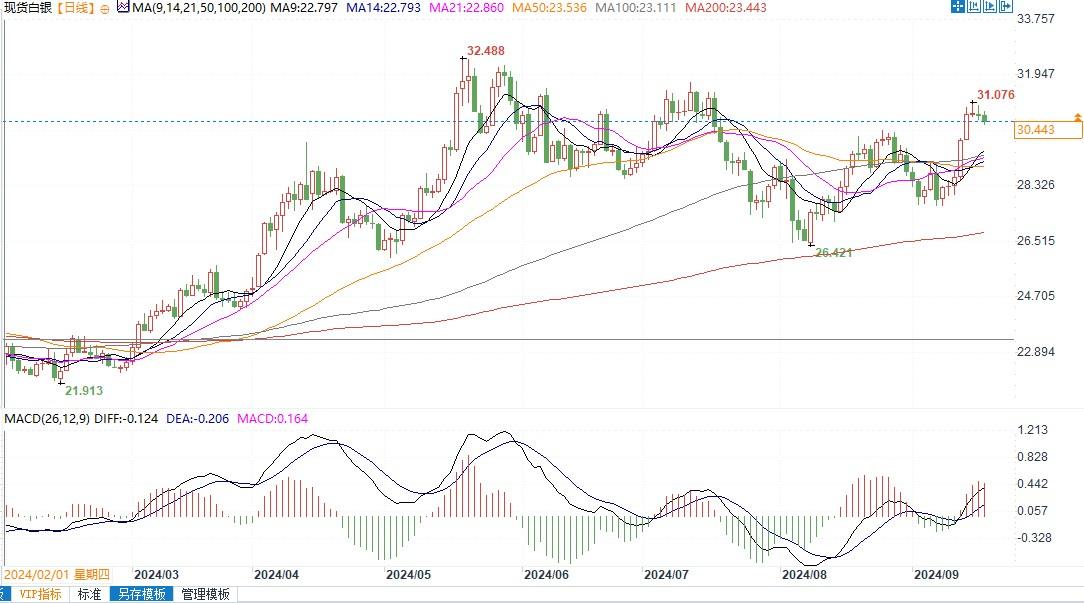
Daily chart of spot silver
Tips:This page came from Internet, which is not standing for FXCUE opinions of this website.
Statement:Contact us if the content violates the law or your rights