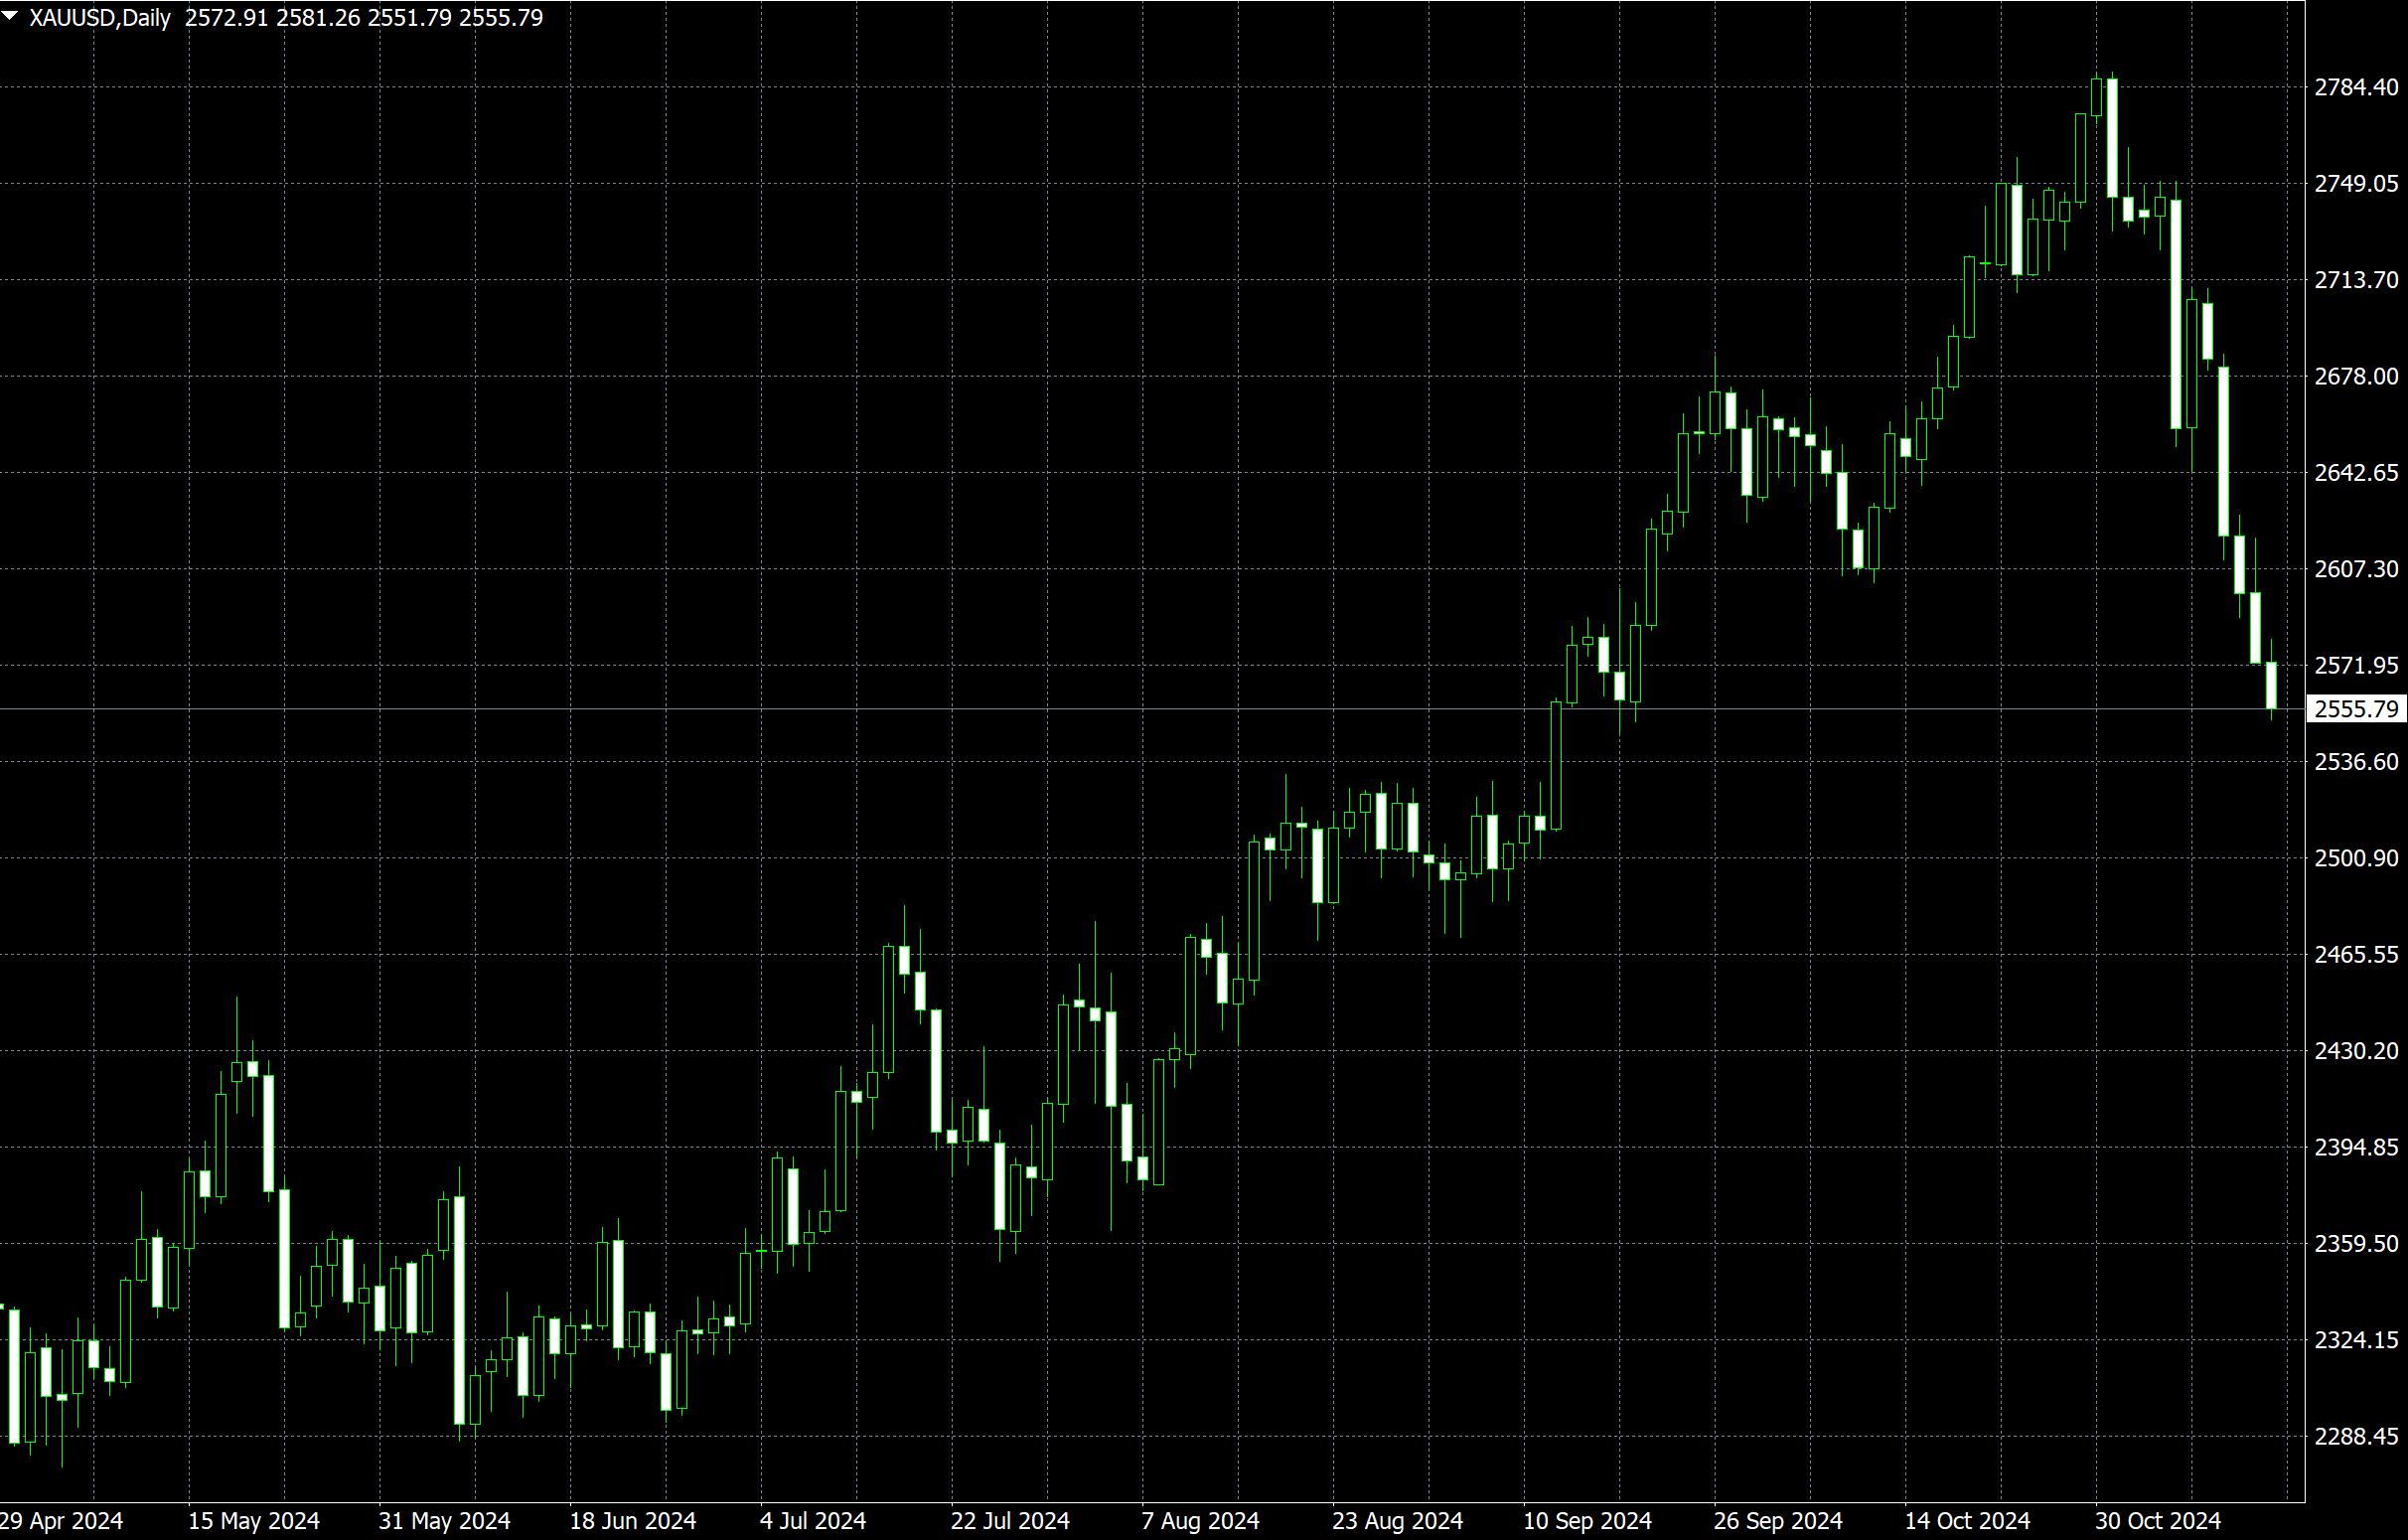
Gold price drops below 2600, bearish entry! If unable to hold onto the support of 2538, it may further fall towards 2500
The price of gold has fallen for the fifth consecutive day At the same time, the rebound of the US dollar after the election continued, climbing to a new high for the year, and the market expects that the policies of US President elect Trump will stimulate economic growth. This is considered an important factor that puts pressure on US dollar denominated commodities.
In addition, investors believe that the Trump administration's series of policies will push up inflation, which may force the Federal Reserve to suspend its loose policies. The US data released on Wednesday (November 13th) also showed a slowdown in the rate of inflation decline, which may lead to a reduction in the number of interest rate cuts next year. Against this background, the rise in the yield of US treasury bond bonds has exerted additional pressure on the gold price.
The general upward trend in global stock markets has also put additional pressure on gold, a safe haven precious metal, supporting expectations of further decline in gold prices. Traders are currently monitoring the US Producer Price Index (PPI) data, which will be released on November 14th at 21:30 Beijing time, in search of short-term opportunities. Focus on Powell's speech to obtain clues on the future path of interest rate cuts.
From a technical perspective, precious metal analyst Haresh Menghani believes that the price of gold falling below the $2600 mark is seen by bears as a new entry signal (which is also the 38.2% Fibonacci retracement level of the June to October gains).
In addition, the indicators on the daily chart indicate that the downward trend of gold prices remains the main trend, and gold prices may fall towards the $2542-2538 range. This area includes the 100 day moving average and the 50% Fibonacci retracement level. If it falls below this level, it will further intensify the correction and may explore the psychological level of $2500.
On the contrary, Menghani believes that if the gold price rebounds, it may encounter resistance at $2580, followed by the integer level of $2600. If it breaks through $2600, it may trigger a short covering market, pushing the gold price further up to $2630-2632. If it breaks through again, it may further test the key resistance of $2660.

Daily chart of spot gold
Tips:This page came from Internet, which is not standing for FXCUE opinions of this website.
Statement:Contact us if the content violates the law or your rights
