Has gold fallen enough? This week, a divine needle is needed to activate multiple heads
Last week (week 11.11-11.15), spot gold plummeted 4.58%, dropping about $125 to close at $2561.52 per ounce, marking the largest weekly decline since June 8, 2021, when it fell 6.04%. Monday (11.11) contributed more than half of the week's decline. However, on Thursday and Friday, there were spindle lines and negative pregnancy star lines, indicating a significant reduction in market selling pressure. Due to signs of a temporary halt in the decline of gold prices after experiencing a deep drop, some radical bulls have been given hope that the long short game may intensify this week. The key question for this week (11.18-11.22) is: Has gold prices fallen enough in this round? What situations will trigger a rebound in bullish sentiment, and what resistance levels should we focus on if there is a rebound?
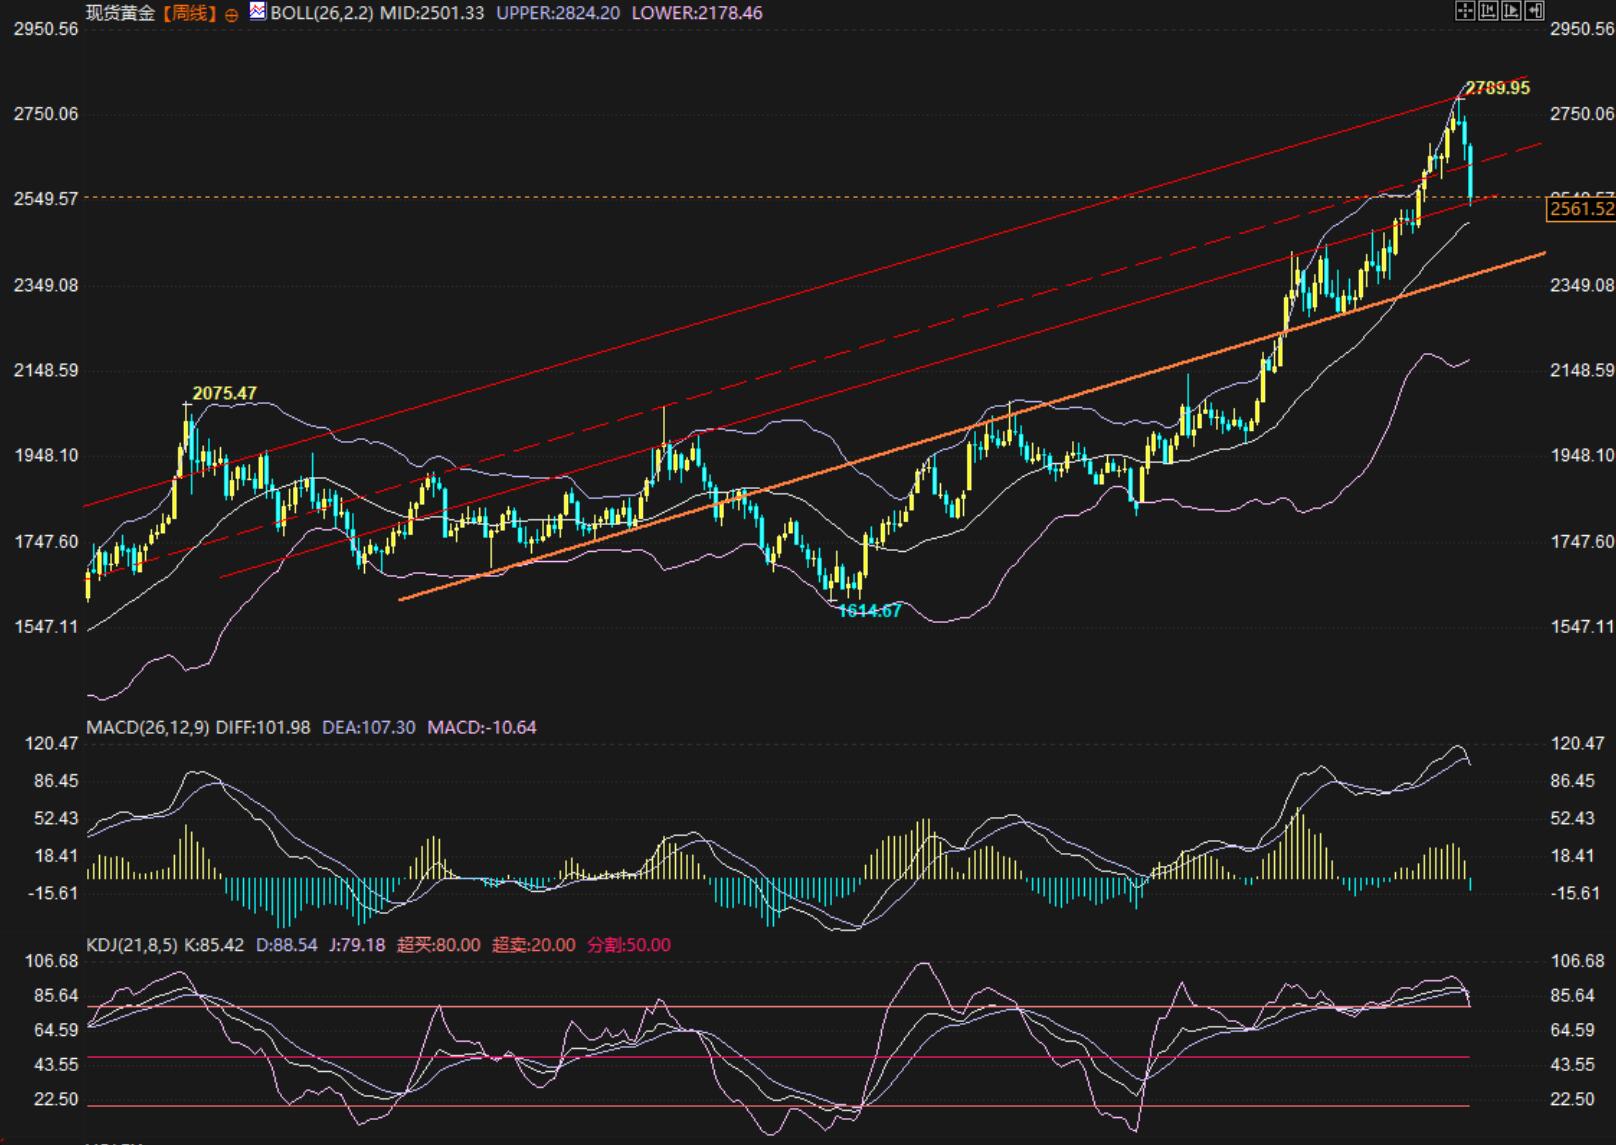
Looking back, the gold analysis chart that was launched before the opening of last Monday (1111) can be considered a failure in recent analysis, as the prediction of the downward target was too conservative (at that time, it was predicted that the price would hold at 2640 and start a rebound). In the analysis content at that time, there were only two points that were quite informative: firstly, there were three red upward sloping lines in the attached weekly chart analysis, among which the lowest red line was very close to the lowest point and closing price of the week, indicating that it played a key supporting role in the market. Secondly, it was mentioned at that time that the latest four K-lines of the weekly chart formed a "variant twilight star". From the recent sharp decline, it can be seen that the shape of this twilight star has indeed exerted great power.
What is the current situation of gold prices? From four perspectives.
From a fundamental perspective, Federal Reserve Chairman Powell stated in the early hours of Friday morning that the Fed is not in a hurry to cut interest rates, which almost extinguished market expectations for a Fed rate cut in December. It is worth noting that after Powell's speech, there was no significant decline in gold prices, indicating that the market has become immune to this news after the sharp drop in gold prices.
From the perspective of supply and demand, due to the high gold price, there is weak demand for physical gold among the public. However, it remains to be seen whether central banks of various countries will increase their holdings.
From the perspective of market sentiment, although many financial experts have expressed that gold prices are still bullish in the medium to long term, for many retail investors, "ten thousand years is too long, seize the day and night". Therefore, compared to the medium to long term, the price of gold in the next week may be more important. A foreign media survey conducted over the weekend showed that although individual investors are bullish on gold prices for the next week, institutions still hold a bearish attitude.
From a technical perspective, the overall gold price belongs to the absolute advantage of bears, but the bearish atmosphere has clearly weakened. However, bullish sentiment has not yet gathered, and the rebound since the low point of 2536 is still weak.. Let's take a closer look at the following detailed analysis.
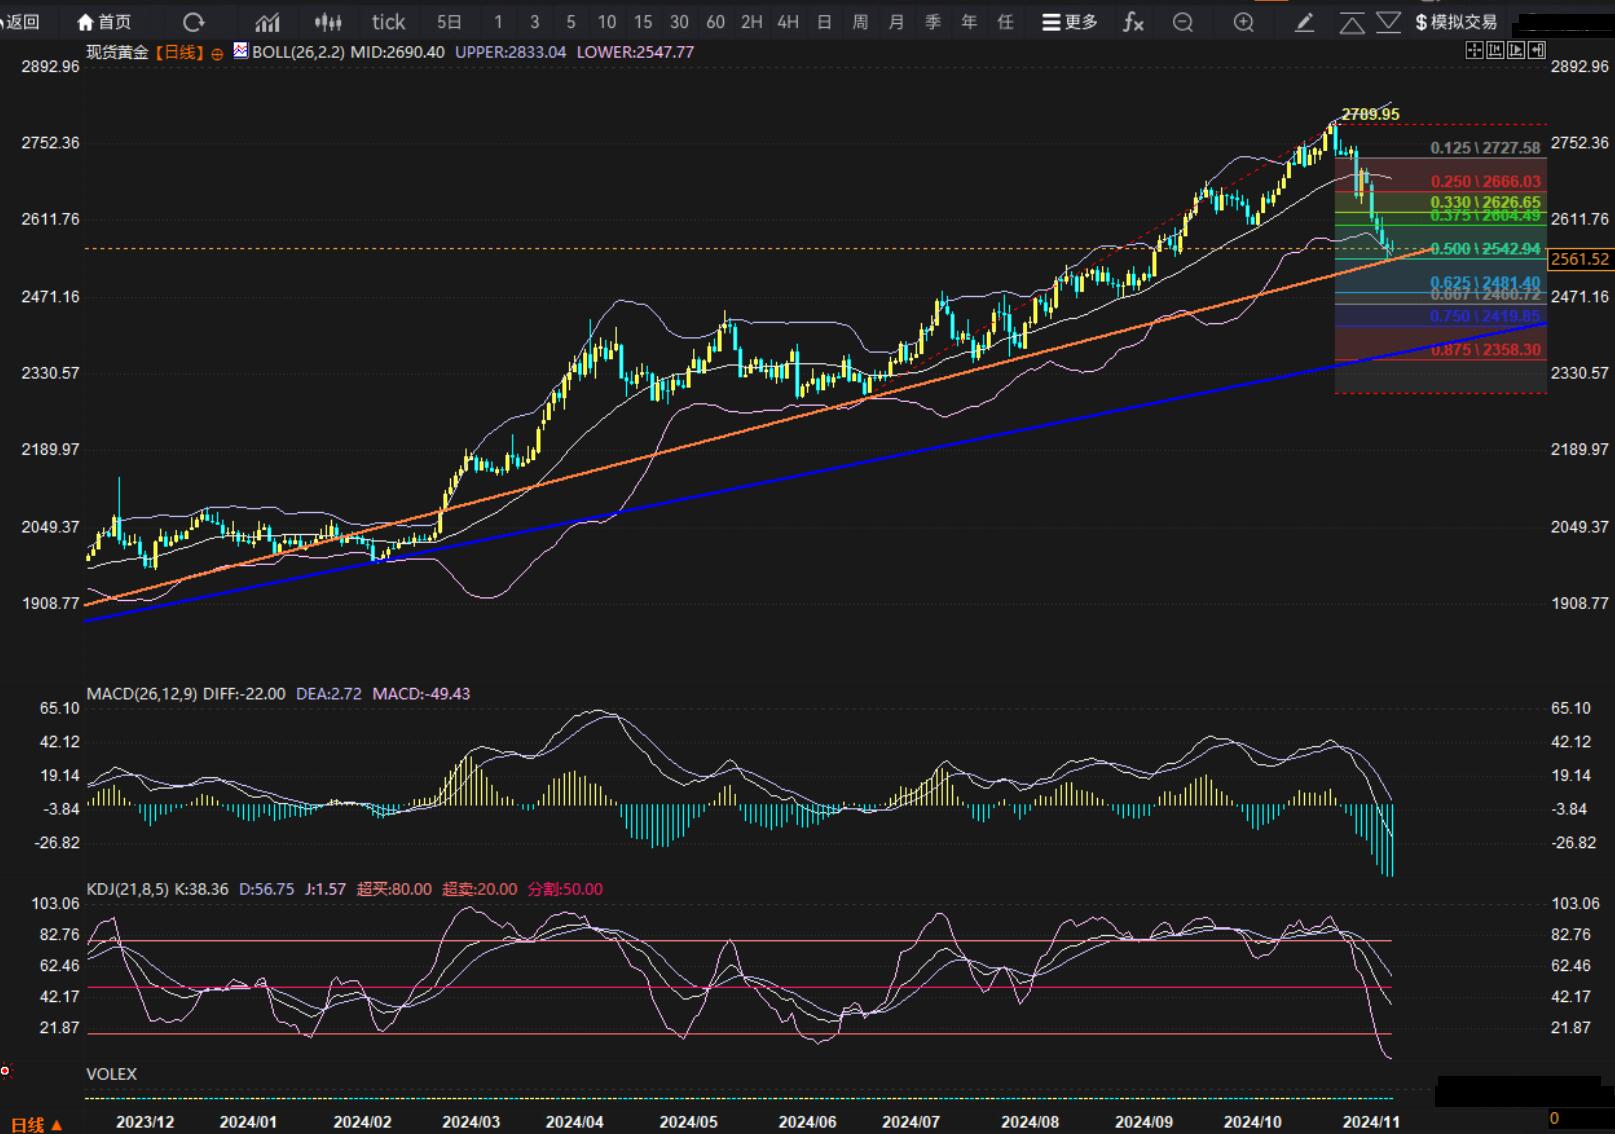
The lowest level of $2536.68 per ounce in nearly two months (since September 12) set by the gold price on November 14 has gathered several heavyweight supports near this low point. This low point is equivalent to testing the 50% retracement of the 100 day moving average and the rising range of 2296-2790, both of which are currently at the 2542.9 level. This is also the first time in the past nine months that the gold price has tested the 100 day moving average, which happens to be the weekly level 20 moving average in terms of cyclical multiples. At the same time, the lowest point also pierced the lower band of the daily Bollinger Bands, and then struggled back to the vicinity of the lower band. In addition, this low point was also tested with an orange bold sloping straight line as shown in the figure. The weekly chart shows a short footed large bearish column, while the daily chart shows a spindle line and a bearish pregnancy star line, which may have a weak rebound but is not a necessary condition for forming a bottom. Therefore, in order for the gold price to experience a decent rebound this week, it may require a "bottoming out needle" (long legged small solid bullish line) at the 15 minute or higher level, which will quickly attract bullish sentiment once it appears.

Technical analysis of spot gold daily chart
Overall, although there are signs of temporary stabilization in gold prices, there may still be a new low after a surge due to the absence of a bottom pattern. If a "bottom probe" bullish line can be formed near the upward support line, it will be a positive signal. According to the usual bottoming pattern, it usually takes a long time for the bottom to consolidate and then a rapid decline to form a new low point, which is quickly supported by buying. And this new low point may require attention to the 2515-2500 area, where 2501 is also the current entry point for the weekly Bollinger Bands. Generally speaking, the weekly chart has not been tested for the Bollinger Bands mid track in the past nine months, which is theoretically a support worth paying attention to. However, the dangerous signal is that MACD is at a high level in the severely overbought area and shows a dead cross, and KDJ is also at a high dead cross, which may provide a great deterrent for those who want to go long. Overall, it is still in a severe overbought callback demand.

Technical analysis of spot gold daily chart
In terms of resistance, if the gold price can break through 2577, the upper resistance will focus on 2590, 2600-2604, 2618, and 2643 in sequence. The possibility of breaking through 2643 at once is low, as this level is the long short transition point of the previous sharp decline. 2708 and 2747 above are both points of interest that may trigger concentrated selling by bears.
In terms of support, the first focus is on 2554-2550, followed by the low point of 2536 set last week. If it falls below, attention should be paid to the psychological levels of 2515 and 2500. If the integer threshold is breached, pay attention to 2485 and 2471. An exaggerated situation is that the gold price is tested within the range of 2431-2287. If it falls into this range, it may trigger a large influx of medium - to long-term buying near 2380, as this is the key trend support for the recent 13 month (since early October 2023) uptrend (the bold blue sloping line in the daily chart above). If it falls below this, it means that the uptrend trend of the past 13 months may reverse.
Tips:This page came from Internet, which is not standing for FXCUE opinions of this website.
Statement:Contact us if the content violates the law or your rights
