Technical analysis of EUR/USD, EUR/JPY, and USD/JPY
On Monday (November 18th) during the European trading session, the US dollar index fell slightly.
EUR/USD, EUR/JPY, and USD/JPY are under pressure as Bank of Japan Governor Kazuo Ueda expects "wage driven inflationary pressures to intensify as the economy continues to improve and companies continue to raise wages," but he did not give a specific date.
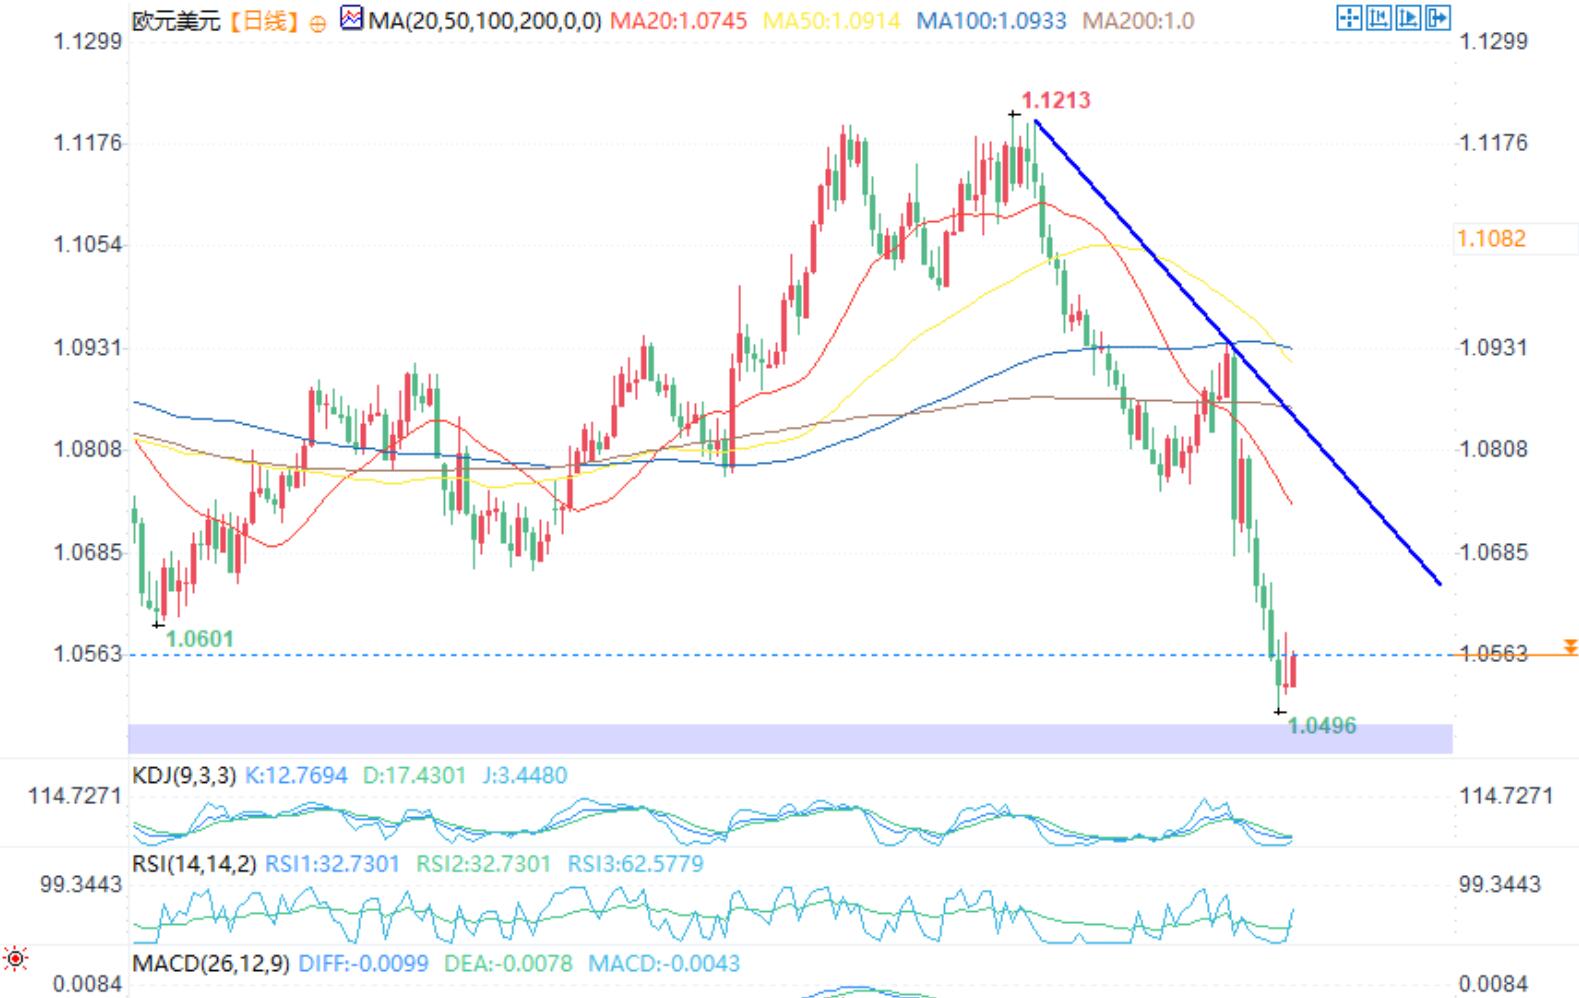
EUR/USD hovering above support level

(EUR/USD daily chart)
Last week, the euro/dollar fell to the two-year main support zone, which includes the November 2023 low of 1.0517 and the October 2023 low of 1.0449. At the beginning of this week, the euro/dollar hovered above last week's low of 1.0497. If the euro/dollar falls, the market will focus on the low point of 1.0449 in October 2023. If it continues to decline, it will fall towards the low point of 1.0423 in January 2023.
The small resistance level above the high of 1.0593 on Friday is located in the 1.0666-83 area.
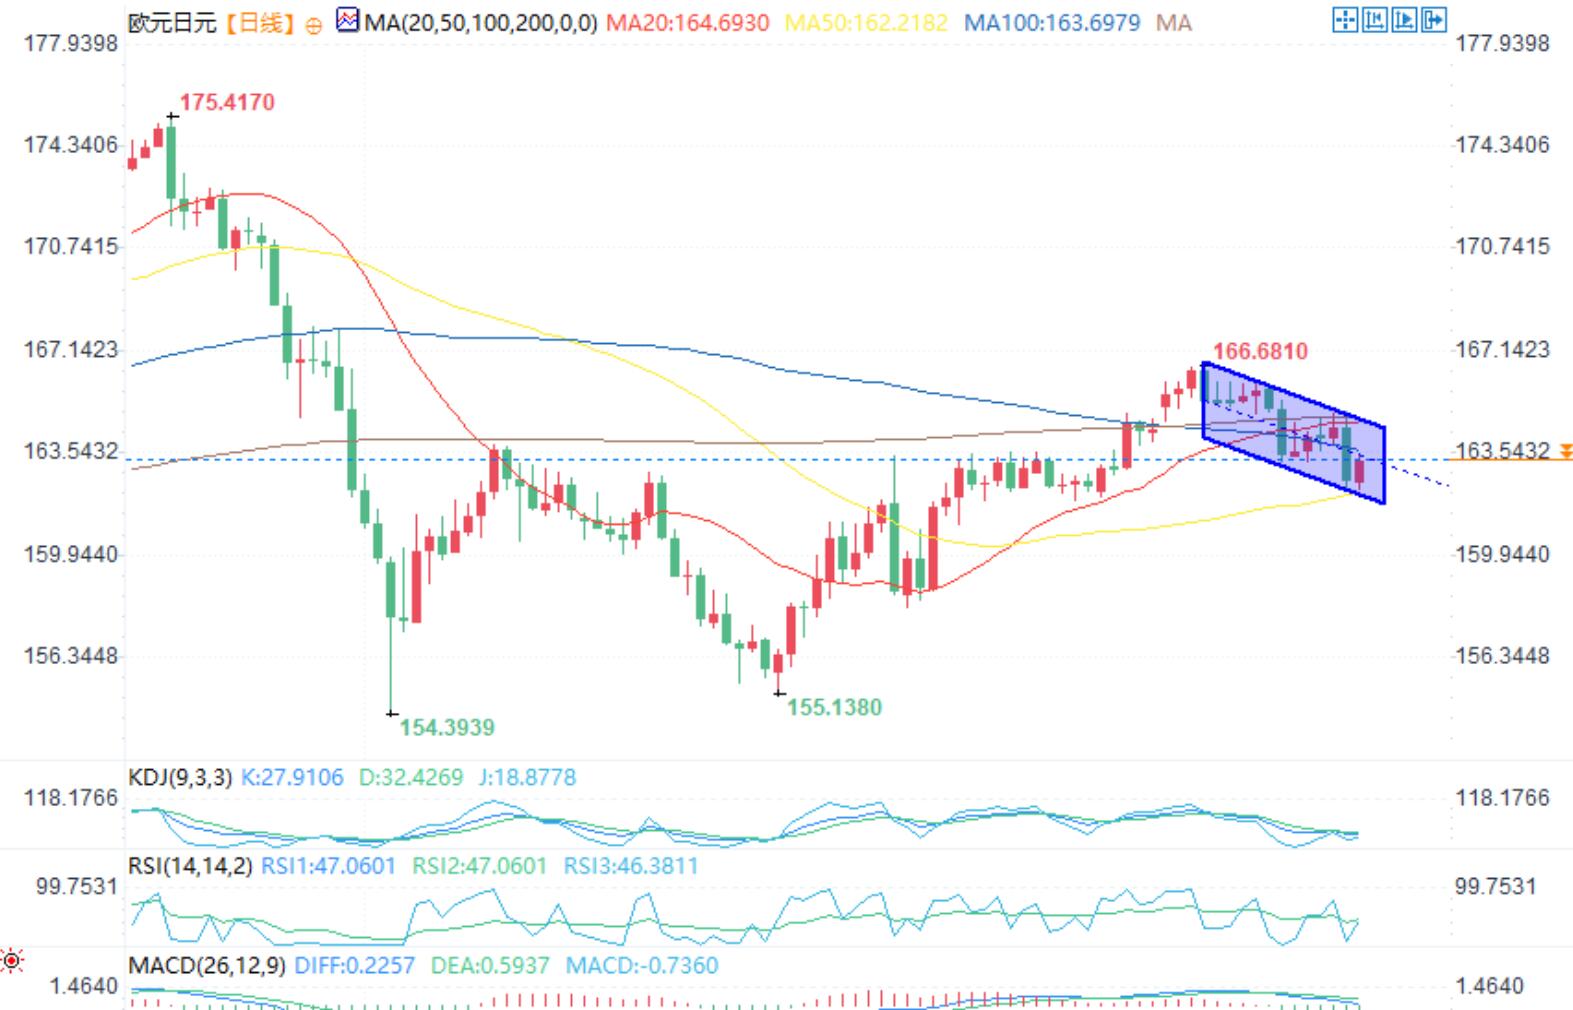
EUR/JPY sliding

EUR/JPY daily chart
The euro/yen continues to trade within the downward channel in November, with the lower channel located at 162.13, providing potential small support between the 55 day moving average of 161.90 and the mid October low of 161.85. If it continues to decline, the price may retest the 160.00 line.
The small resistance level of 164.87 above the high of 163.60-89 in August, September, and early October can be found along the 200 day simple moving average (SMA).
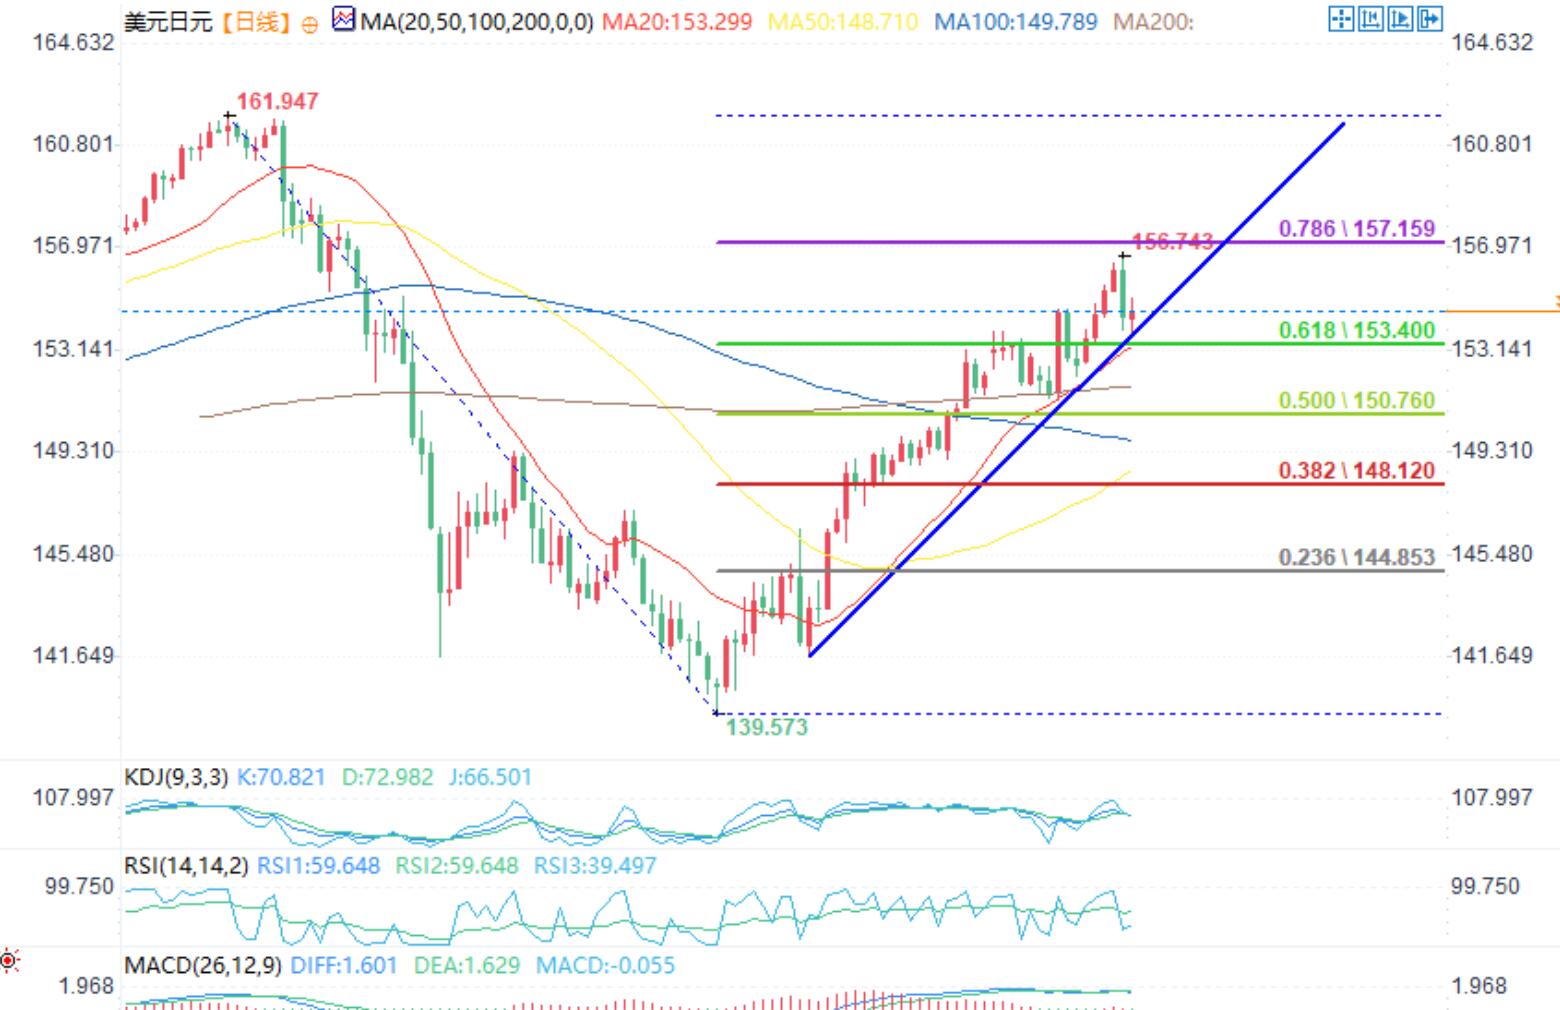
USD/JPY gains pause

USD/JPY daily chart
The USD/JPY continues to fluctuate, with Bank of Japan (BoJ) Governor Kazuo Ueda stating that "wage driven inflationary pressures will intensify as the economy continues to improve and businesses continue to raise wages," but he did not provide a specific date as "the actual timing of the adjustment will continue to depend on economic activity, prices, and future financial conditions.
After reaching a high of 157.70 near the end of May, the US dollar/Japanese yen took a breather near the high of 153.88 on October 28th. Further small support levels are seen at the high of 153.19 on October 23, and if further down, it will fall along the 200 day moving average to 151.82.
Tips:This page came from Internet, which is not standing for FXCUE opinions of this website.
Statement:Contact us if the content violates the law or your rights
