Technical analysis of USD/JPY, AUD/USD, and NZD/USD on November 20th
On Wednesday (November 20th) during the European trading session, the US dollar index closed at 106.6848, an increase of 0.48%.
Despite higher than expected inflation data last week and Powell's less dovish stance, the US dollar continues to consolidate. The market pricing remains basically unchanged, and interest rates will be lowered three times by the end of 2025.
This may be a signal that the market is now satisfied with the current pricing, and we will need stronger reasons to price the remaining rate cuts. This may lead to a general weakness of the US dollar in the short term.
The following is a technical analysis of three currency pairs: USD/JPY, AUD/USD, and NZD/USD.

In terms of the Japanese yen, the market expects a possibility of a 47% interest rate hike in December, with a total tightening of 45 basis points by the end of 2025. The reason for the high possibility of a rate hike in December may be entirely due to the rapid depreciation of the yen, which was one of the main reasons for the last rate hike.
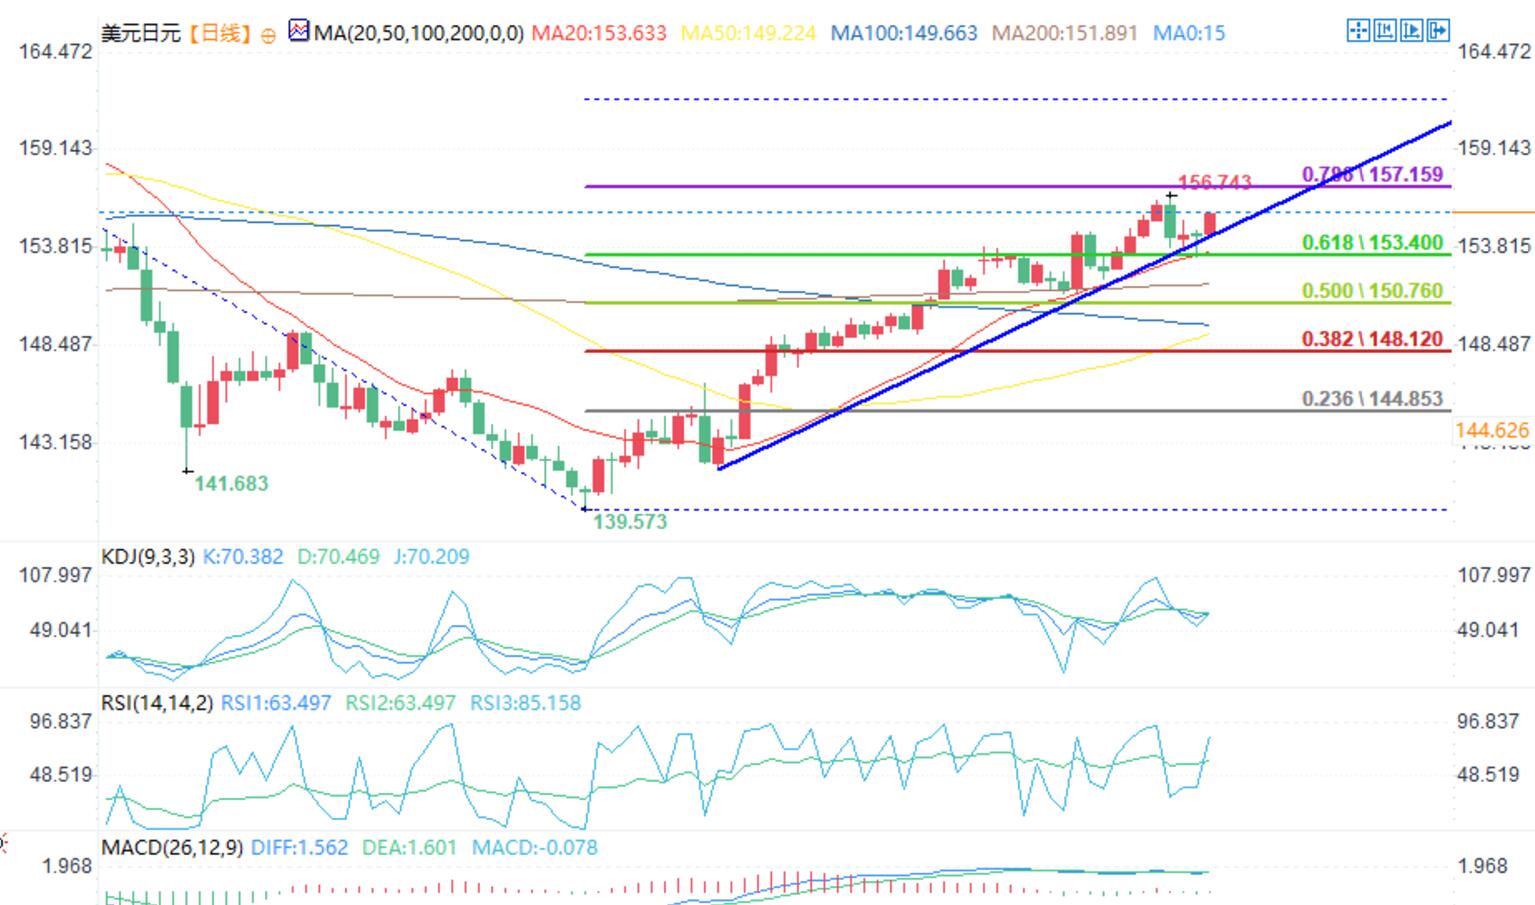
On the daily chart, the US dollar/Japanese yen fell below the trend line yesterday due to some risk aversion sentiment, but eventually rebounded strongly. When the price rebounds above the trend line and continues to target the 160.00 level, buyers flock in. On the other hand, sellers hope to see prices fall below the trend line and prepare for a drop to the support level of 152.00.
On the 4-hour chart, we can see more clearly the recent price trend, breaking below the trend line and rebounding above it. We can expect buyers to increase their bullish bets on breaking the recent high of 156.80, while sellers may rely on this to break below the trend line.

In terms of the Australian dollar, the market expects that the Reserve Bank of Australia will not cut interest rates in December, but it is expected that there will be two interest rate cuts in 2025. The Australian economic data remains robust, while inflation continues to slowly decline, keeping the Reserve Bank of Australia neutral.
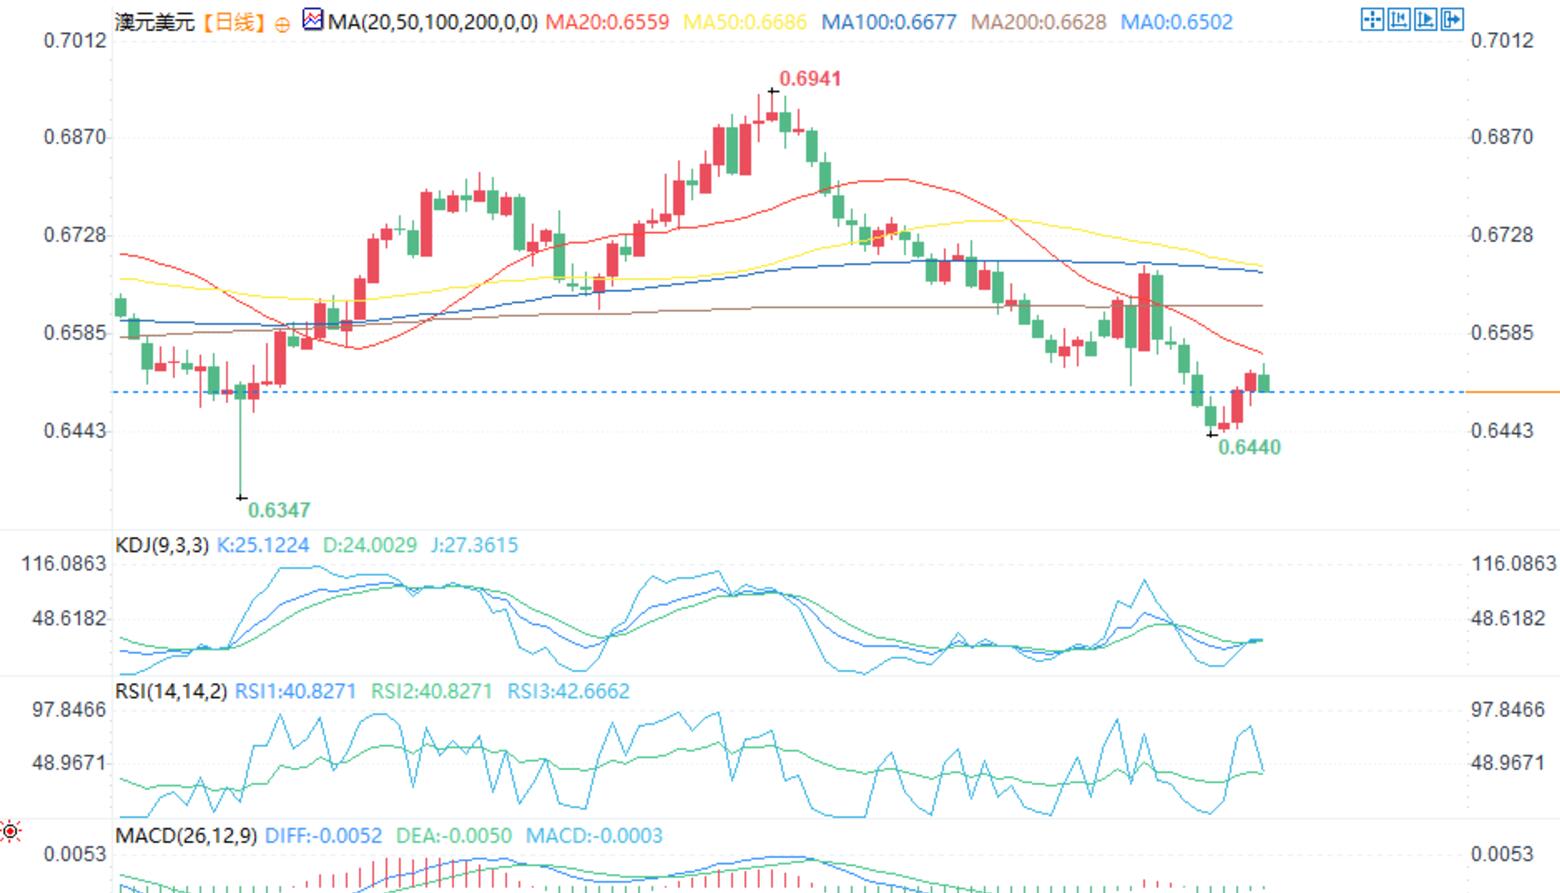
On the daily chart, the Australian dollar/US dollar is currently testing the key volatility low point of 0.6540. Here, we can expect sellers to enter this level with clear risks, preparing for the next drop to the level of 0.6365. On the other hand, buyers hope to see a price breakthrough to increase their bullish bets to new highs.
On the 4-hour chart, we can see a Fibonacci retracement level of 38.2%, which adds some resistance to the volatility low point. If the resistance level is broken and the price rises, it may trigger a rebound into the main trend line and the 61.8% Fibonacci retracement level around 0.66.

In terms of the New Zealand dollar, the market expects an 80% chance of a 50 basis point rate cut at the upcoming meeting, with a total rate cut of 142 basis points by the end of 2025. Inflation has returned to the target range of the Reserve Bank of New Zealand, so the central bank can now focus on economic growth, especially as unemployment continues to rise.
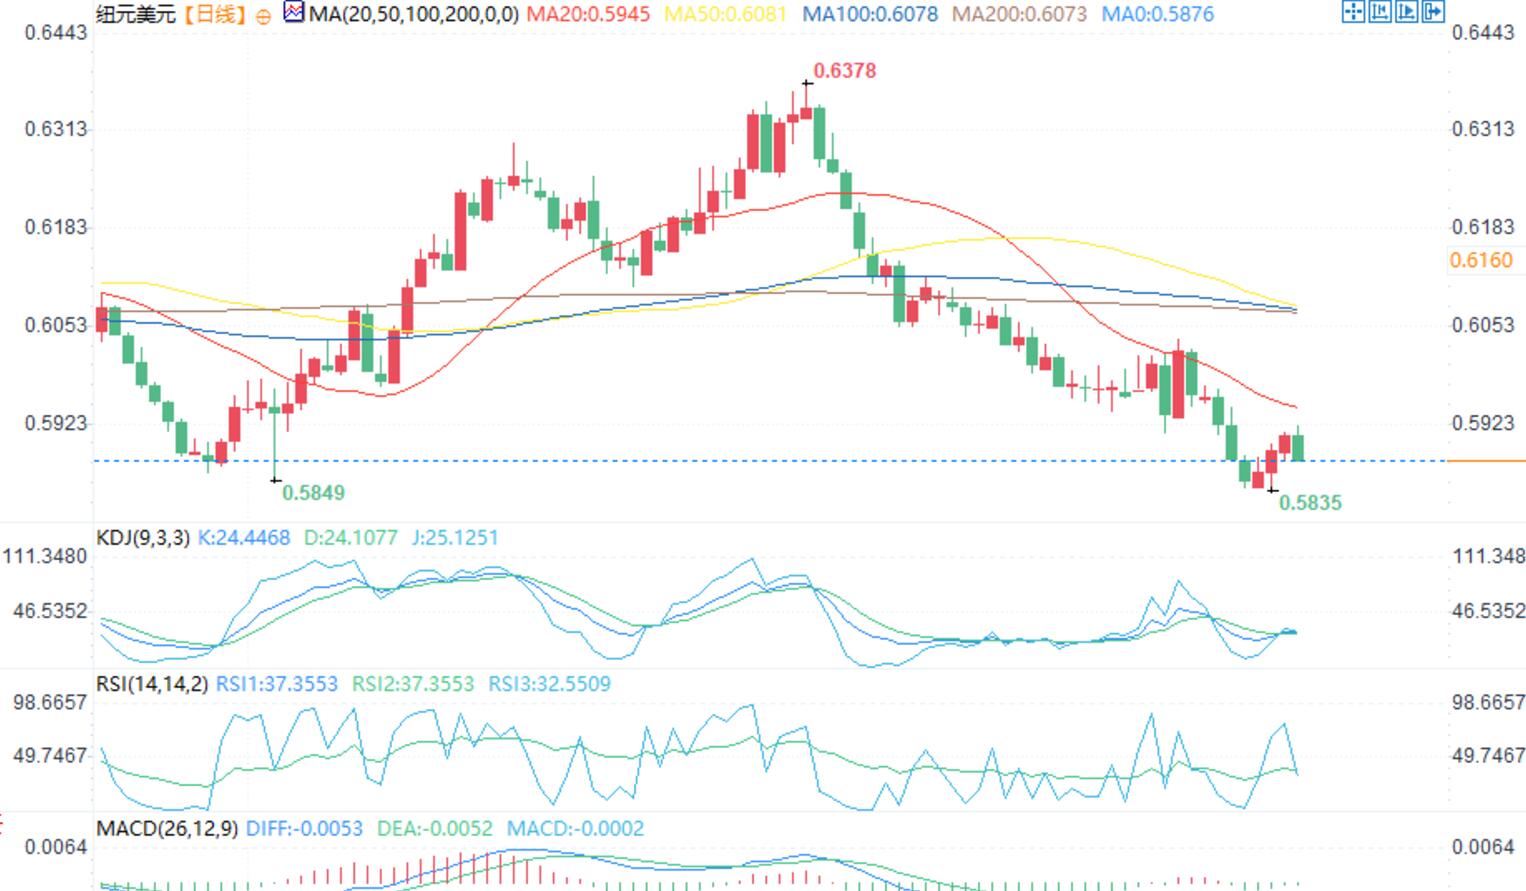
On the daily chart, we can see that the NZD/USD rebounded from the key support level around 0.5850 and rebounded to the main trend line, where we encountered some resistance as sellers returned. Buyers will want to see prices break above the trend line to increase their bullish bet on the resistance level of 0.6050, while sellers will seek to break below the support level of 0.5850 to reach the target low of 0.5773.
On the 4-hour chart, we can see that the price has rejected the low volatility of 0.5912 near the main trend line, as the seller has entered a clear risk above the trend line, with the goal of breaking below the support level of 0.5850. We don't have much else to add here, as buyers need to break through the trend line to gain more confidence in further upward movement.
Tips:This page came from Internet, which is not standing for FXCUE opinions of this website.
Statement:Contact us if the content violates the law or your rights
