Analysis of the Trend of Foreign Exchange Gold and Crude Oil on November 26th
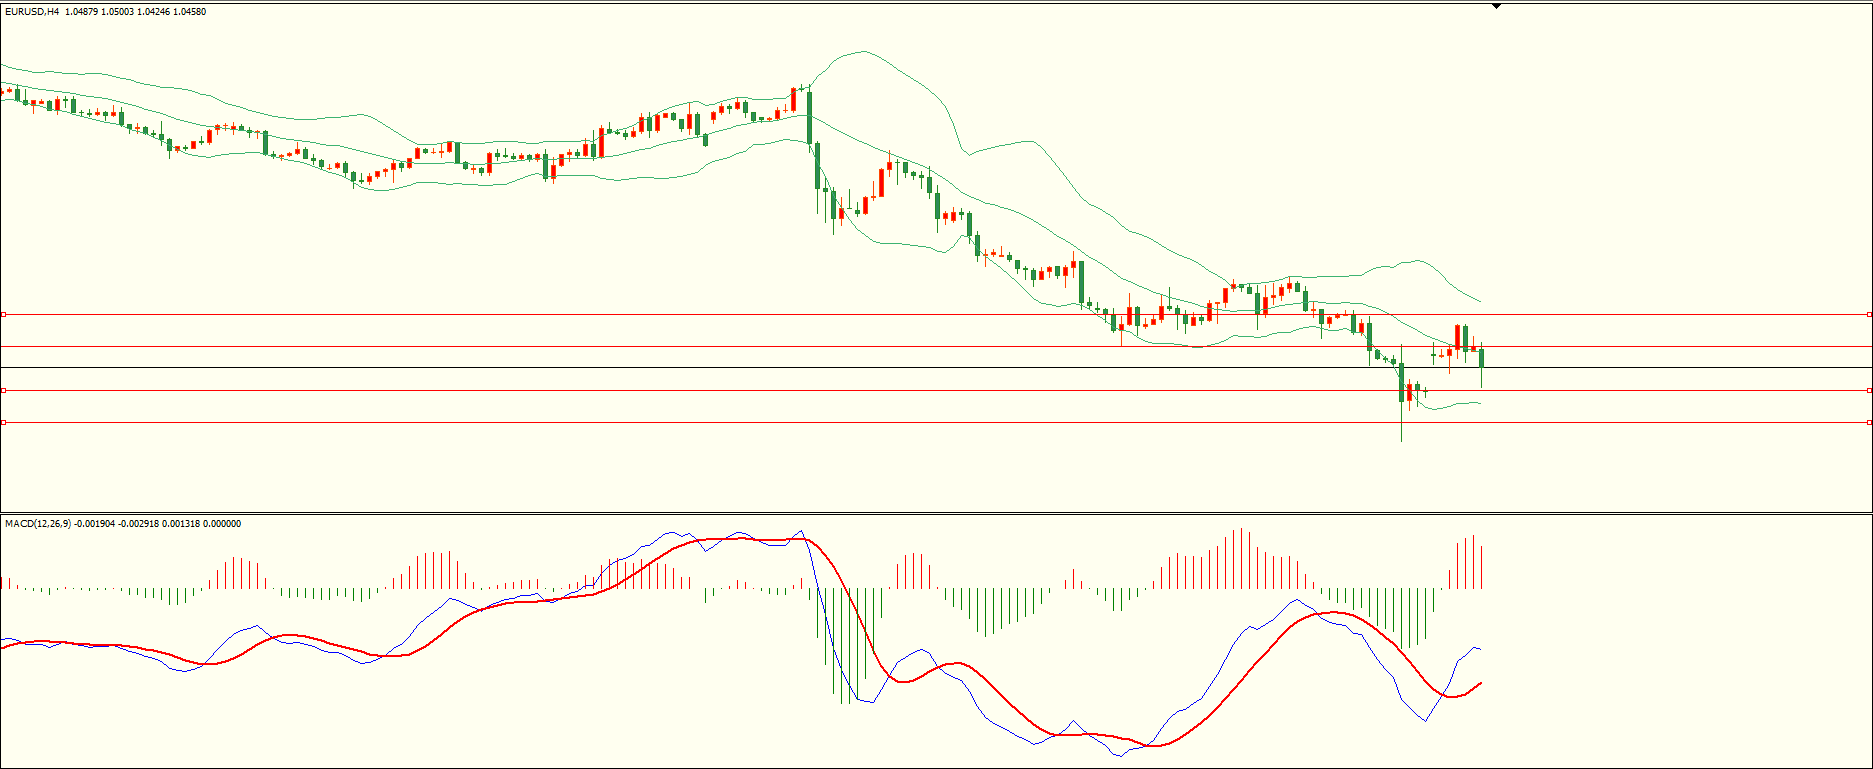
The euro rebounded yesterday and fell under pressure near the first resistance line. The daily chart closed with a small bullish candlestick above and below the shadow line. From the close, the upper resistance still exists, while the lower support is maintained. The short-term long short oscillation is expected to continue. Combined with the 4H trend, the Bollinger Bands are below the middle limit, and the MACD zero axis is running below. The upper resistance is 1.0490, the second resistance is 1.0545, and the lower support is 1.0415, 1.0365. It is expected that the short-term will retest the first support line below the first resistance line.
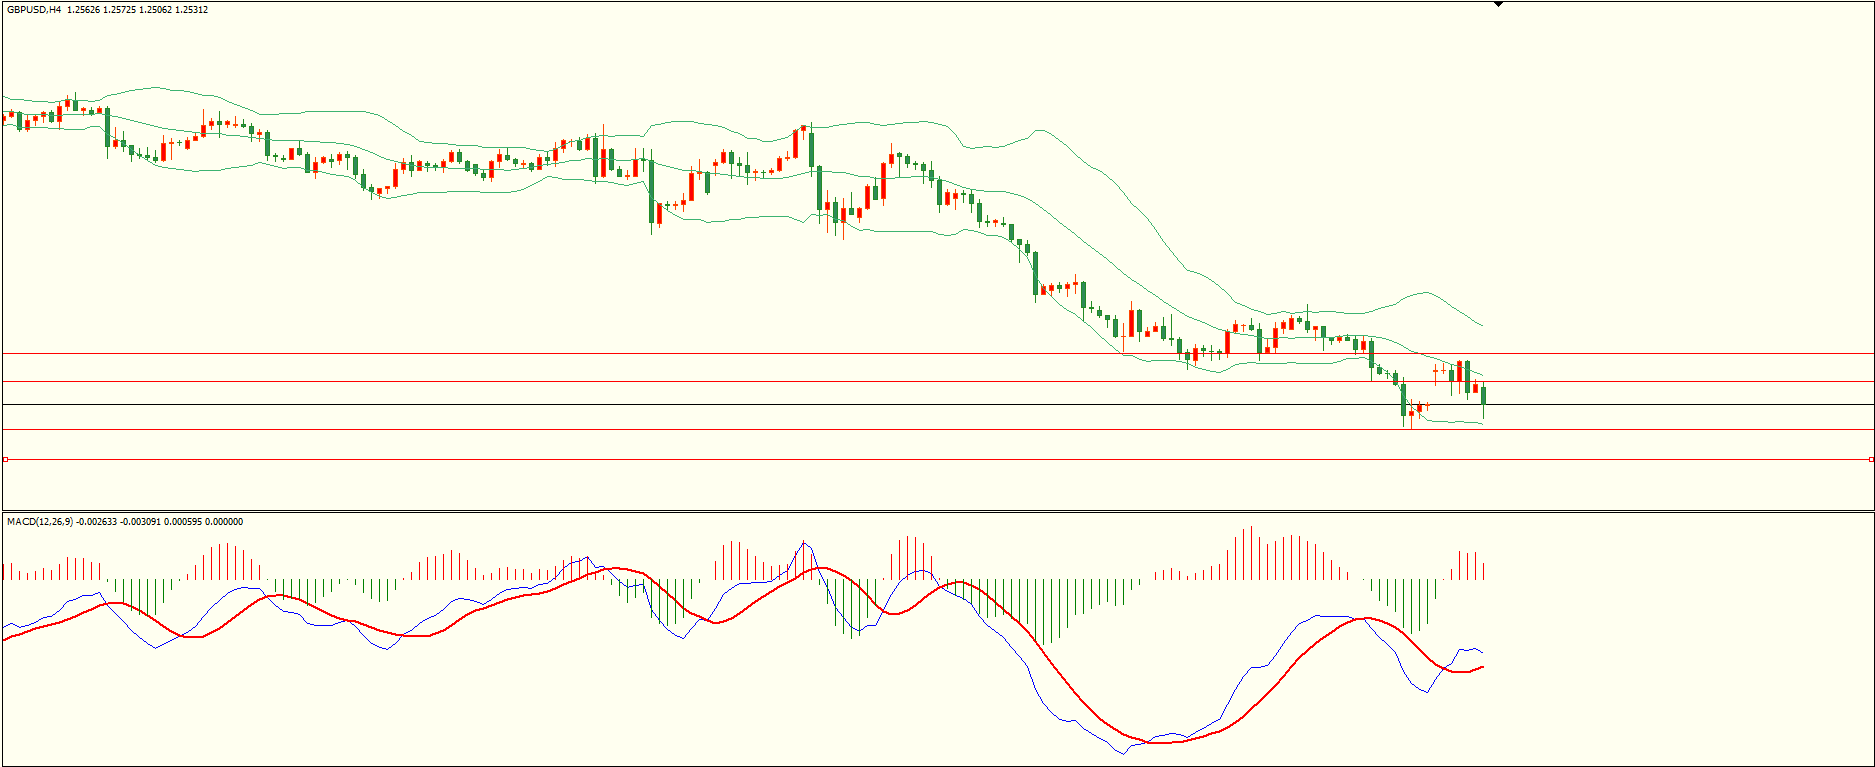
After a volatile rebound yesterday, the pound encountered resistance and fell back. At the close, it hit the first support with slight fluctuations. The daily closing line closed at the upper and lower shadow lines with a bearish candlestick. Overall, bears had a slight advantage. From a 4H perspective, the Bollinger Bands were slightly lower, and the MACD zero axis was running below. The top resistance was 1.2575, the second resistance was 1.2620-30, and the bottom support was 1.2485 and 1.2430. The first resistance is expected to test the first support in the short term before it recovers.
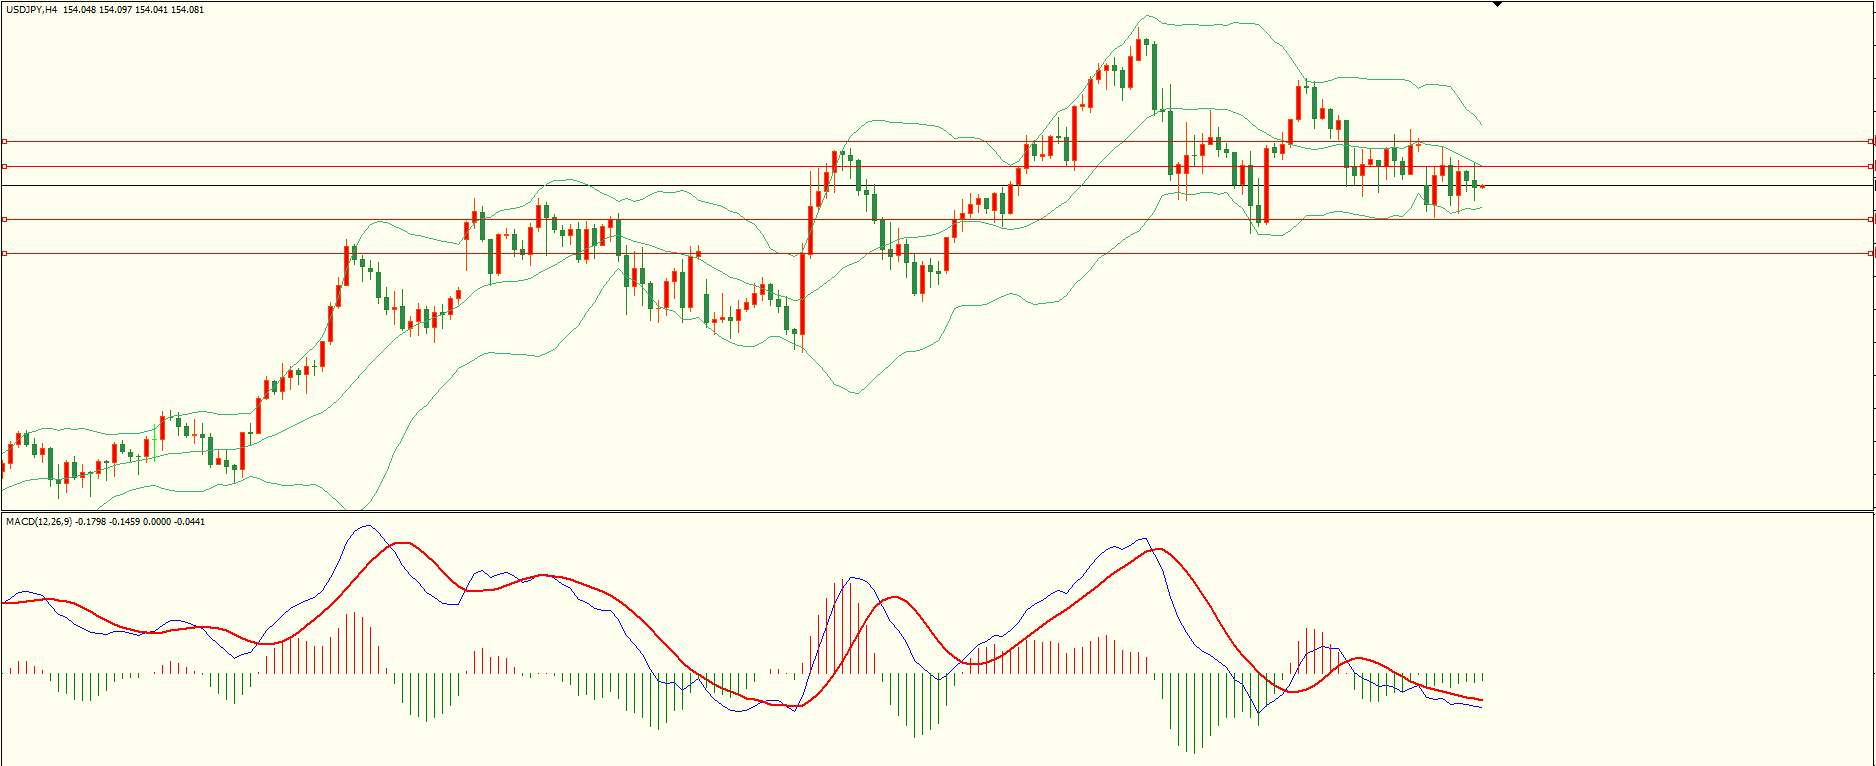
The USD/JPY hit the second resistance yesterday, rising and falling back, but the space below is limited. The daily chart closed with a small bullish candlestick above and below the shadow line. Currently, there is still a dense support area below the front low, and it can only continue after falling. From the 4H perspective, the upper and lower Bollinger Bands have slightly narrowed, and the MACD zero axis is running below. The main resistance above the day is 154.40, the second resistance is 154.80-90, and the lower support is 153.50152.95. It is expected to test the first support below the first resistance in the short term.
XAUUSD
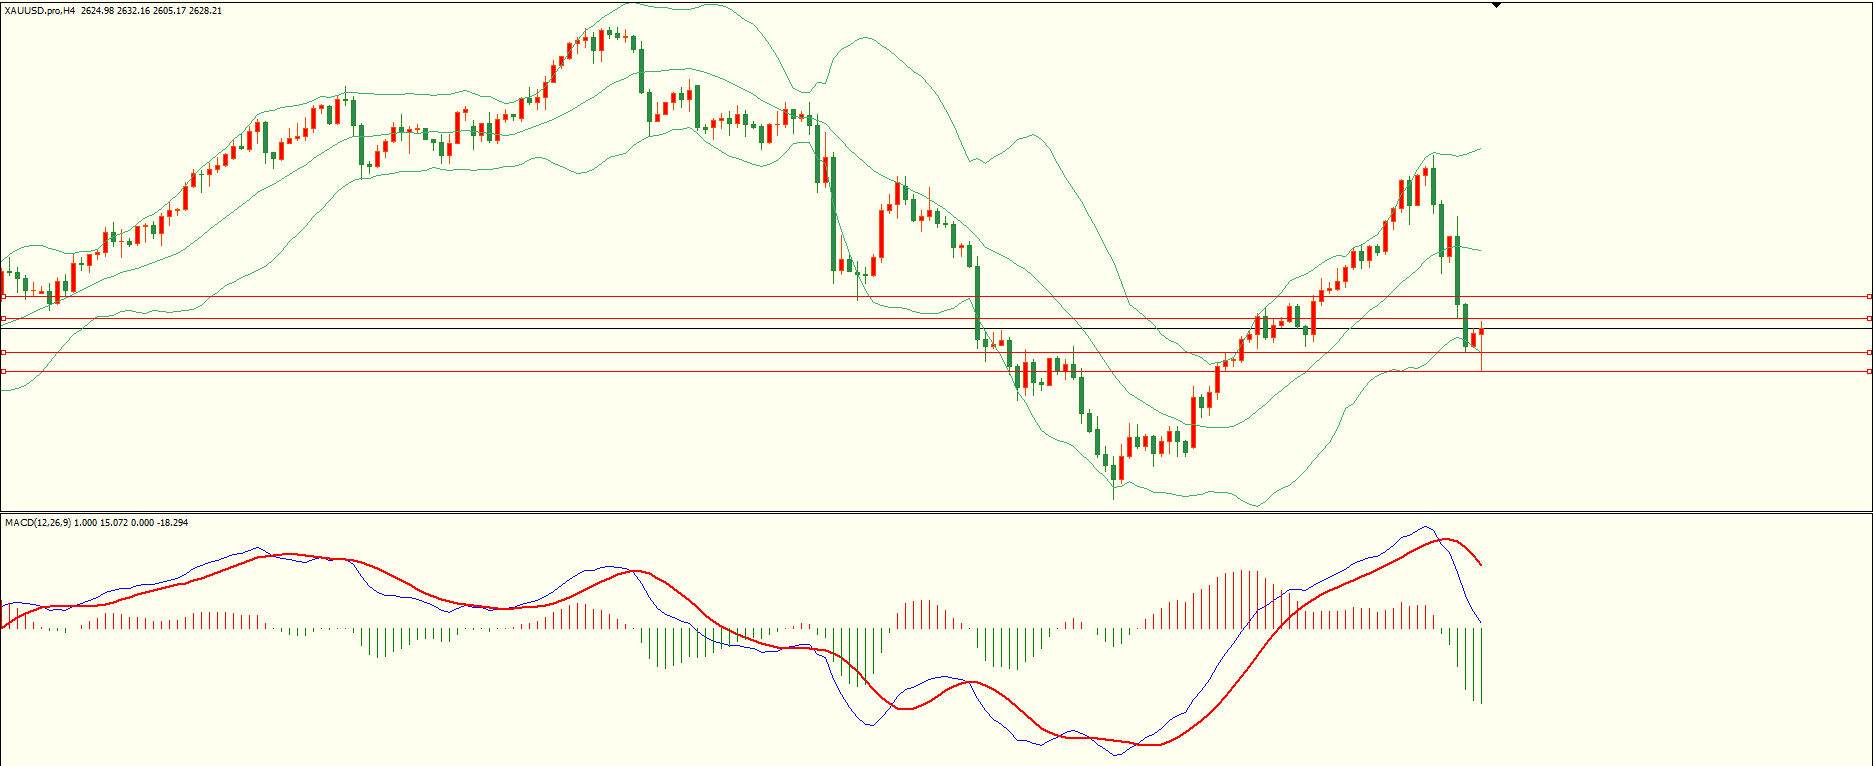
Gold rose first and then fell again yesterday, with the intraday decline expanding under the pressure of negative factors. The daily closing price showed a large bearish candlestick with upper and lower shadows. From the closing point, the upper resistance remained, while attention should be paid to the lower support area. Only after breaking below can the downward space be opened. Combined with the 4H trend, the upper and lower Bollinger Bands slightly expanded, and the MACD zero axis was running near it. The main upper resistance was 2633-35, the second resistance was 2645, and the lower support was 26152605. The first resistance is expected to rebound in the short term before it recovers.
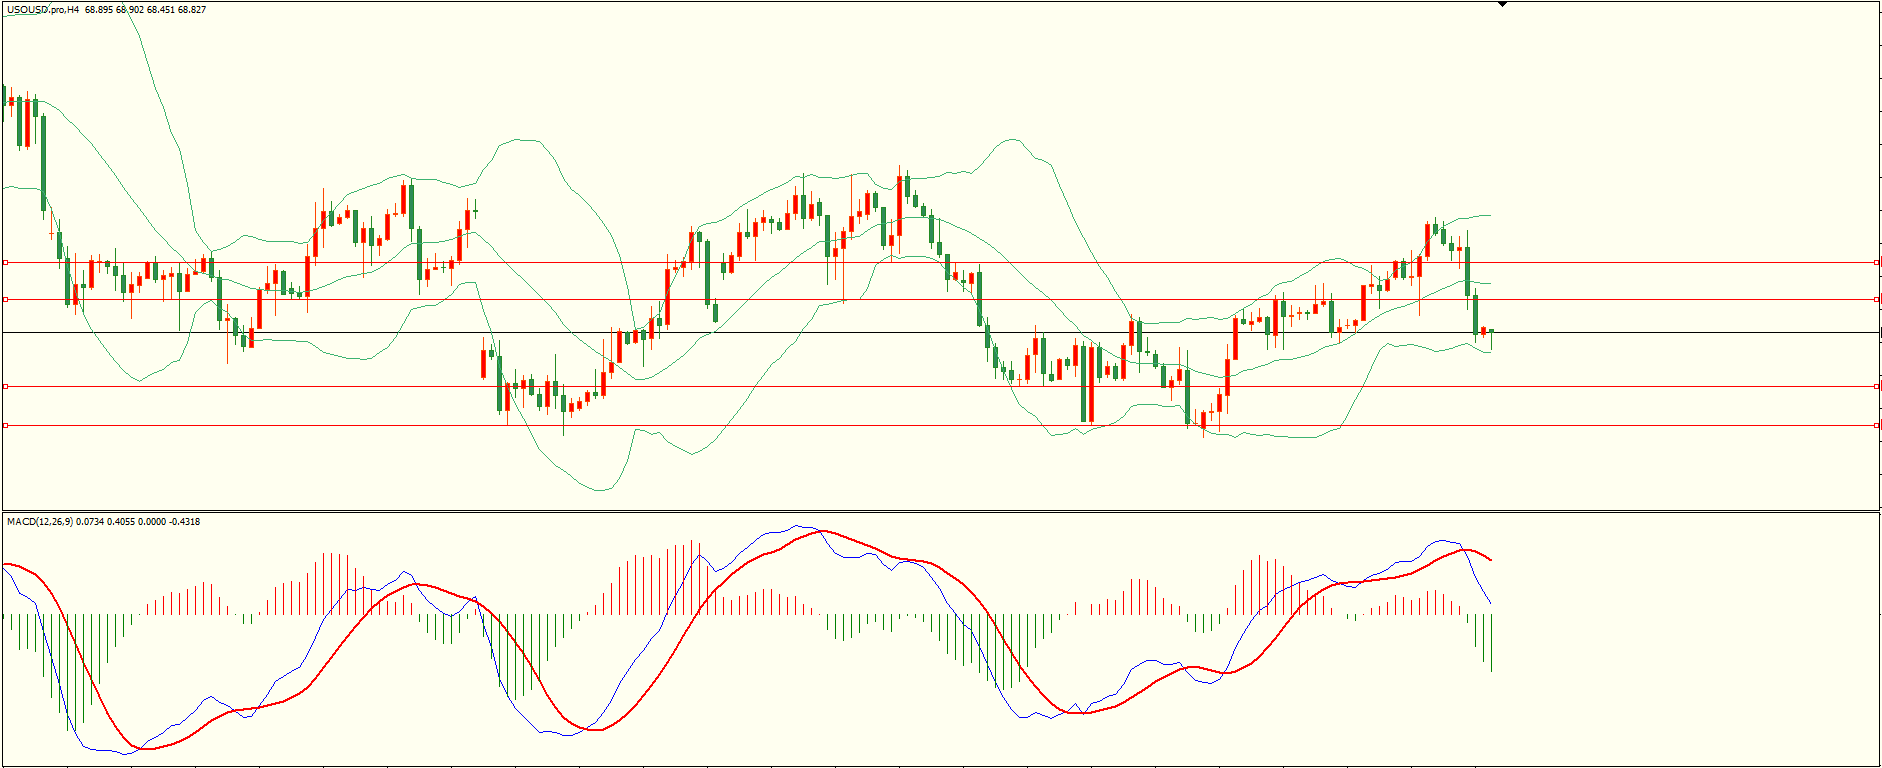
After rebounding yesterday, crude oil fell under pressure and continued to hit a new low for the day at the close. The daily chart closed with a bearish candlestick in the upper and lower shadow lines, and the closing position once again touched the previously dense support zone. After falling, it can continue. From a 4H perspective, the Bollinger Bands slightly turned around, running near the MACD zero axis. The first resistance above the day was 69.55, the second resistance was 70.30-40, and the lower support was 67.60, 66.75. It is expected to test the first support below the first resistance in the short term.
Tips:This page came from Internet, which is not standing for FXCUE opinions of this website.
Statement:Contact us if the content violates the law or your rights
