Interpretation of 6 key technical charts: Spot gold weekly MACD shows negative growth, How will the market trend in 2025 go?
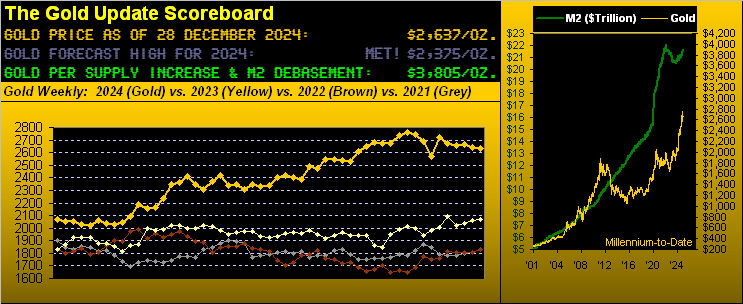
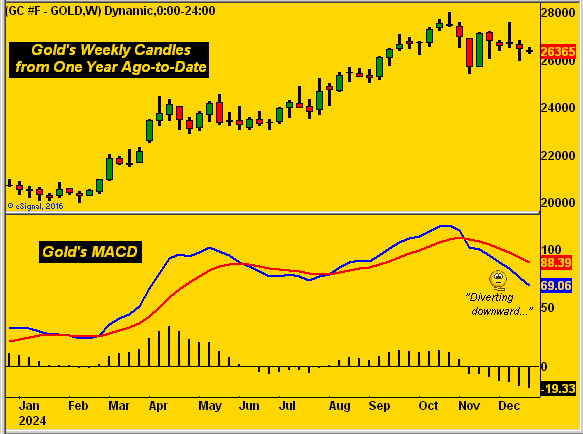
The gold price has just recorded its seventh week of decline in the past nine weeks. Gold analyst Mark Mead Baillie stated that the key technical chart proves that the MACD of the gold weekly line is showing negative growth, and the weekly parabolic trend is still bearish. He said that it is expected to reverse the sluggish market in the new year of 2025.
Mark mentioned that it can be confirmed that the 21 day (one month) linear regression trend of gold is negative, as shown in the following figure. The red dot weekly parabolic trend is still bearish and has been ongoing for seven weeks. In the past nine weeks, the seven downward lines of gold have been red, and the two upward lines have been green:
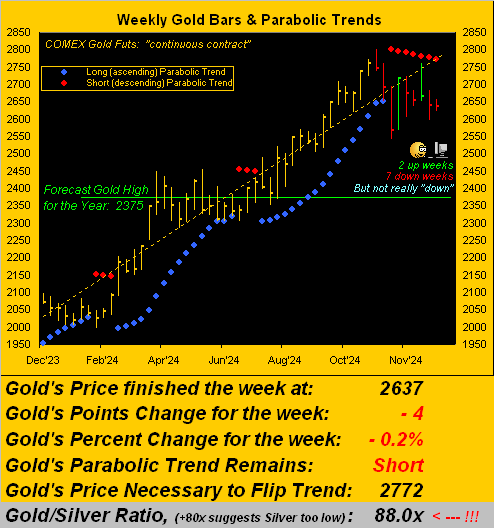
He explained that the parabolic trend is bearish, with prices only rising for two weeks. However, gold seems hesitant rather than declining. However, it still takes $135 to climb from the current level of $2637 to the next week's level of $2772 to 'turn bullish'. Given that the expected weekly trading range for gold is $85, unless there is any buying frenzy, this trend is likely to remain bearish during the 2025 New Year period.
In addition, as pointed out in recent news, the weekly moving average convergence divergence (MACD) of gold continues to show negative growth, as shown below. Similarly, by measuring the previous MACD decline, it is not a bad thing for gold to touch above $2400 in this uptrend:
Mark said, "This is our view on the recent decline of gold. Now let's consider our view on the recent rise. The market magnets of all three elements of the metal giants seem to be preparing to penetrate upwards, which means that prices may rise in the new year
He pointed out that prices will inevitably be pulled back to their magnetic field lines. However, as a trading tool, when the price breaks through its magnetic field lines, further recent price follow-up is the expected rule, not the exception.
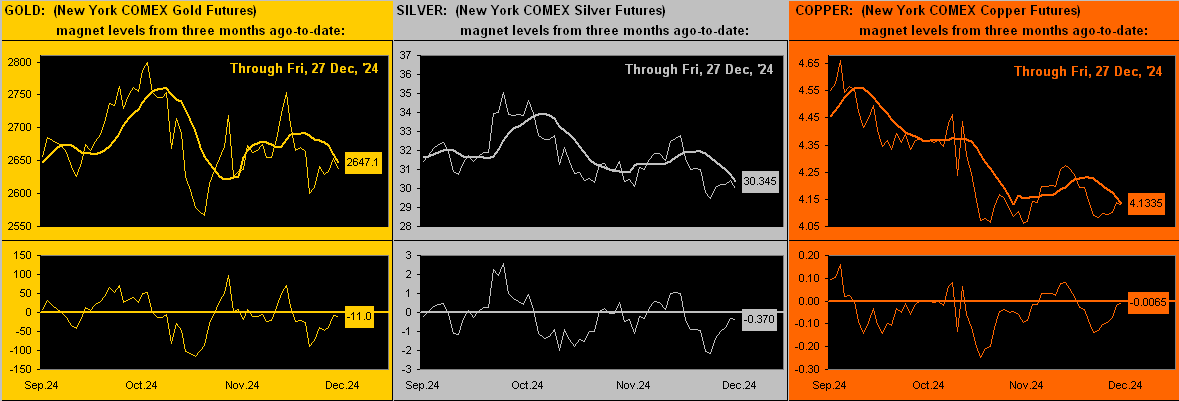
The upper panel of each market tracks the daily closing price (thin line) from three months ago to present; The thick lines are magnetic field lines. The lower panel shows the oscillation difference after subtracting the magnetic field lines from the price. In these three cases, it is evident that prices are now preparing to break through the magnetic field lines upwards, indicating that metal prices will rise in the new year.
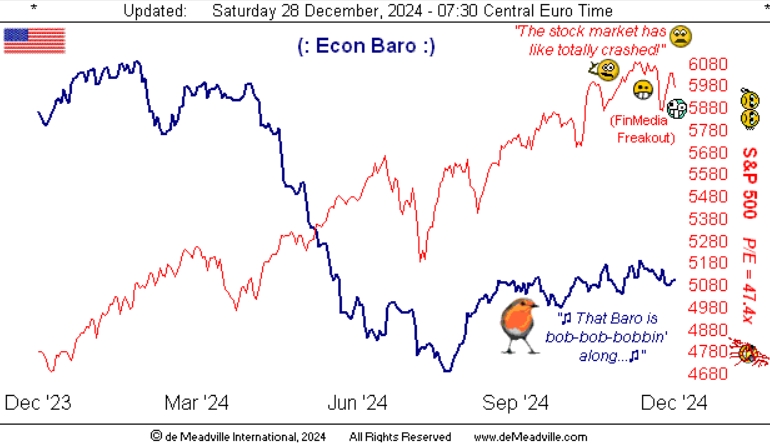
At the same time, the economic barometer is striving to further rise, despite maintaining its original momentum throughout the autumn. Due to only four indicators about to be released, the economic barometer has shown mediocre performance over the past week. It is worth noting that the consumer confidence index in December also declined after the contraction of durable goods orders in November; However, the sales volume of new houses did increase this month.
The vote by the Federal Open Market Committee (FOMC) to lower its banks' funds rate again to release a policy statement on January 29th next year seems to lack momentum. In addition, as mentioned in this article a week ago, the inflation rate in the United States is still somewhat high and does not meet the expectations of the Federal Reserve. Anyway, here is the barometer:
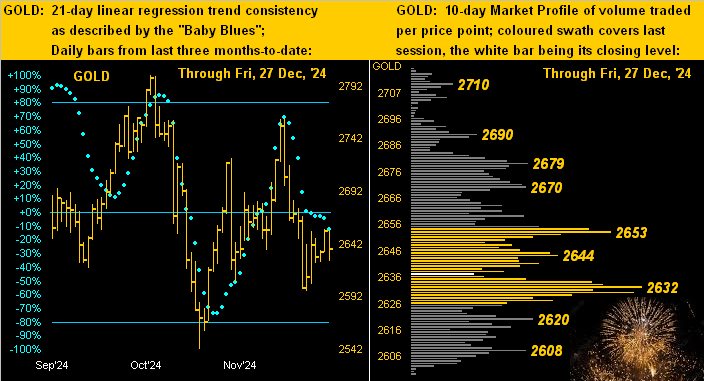
Mark said, "As shown in the following chart, the left side is the daily price chart from three months ago to the present, and the right side is the 10 day market overview. Although gold usually shows an upward trend in the last two days of the year, the light blue dots below indicate trend consistency breakthroughs." As for the overview, Mark marked a series of noteworthy support and resistance levels.
Tips:This page came from Internet, which is not standing for FXCUE opinions of this website.
Statement:Contact us if the content violates the law or your rights
