Safe haven demand and US policies may drive a new round of gold price increases!
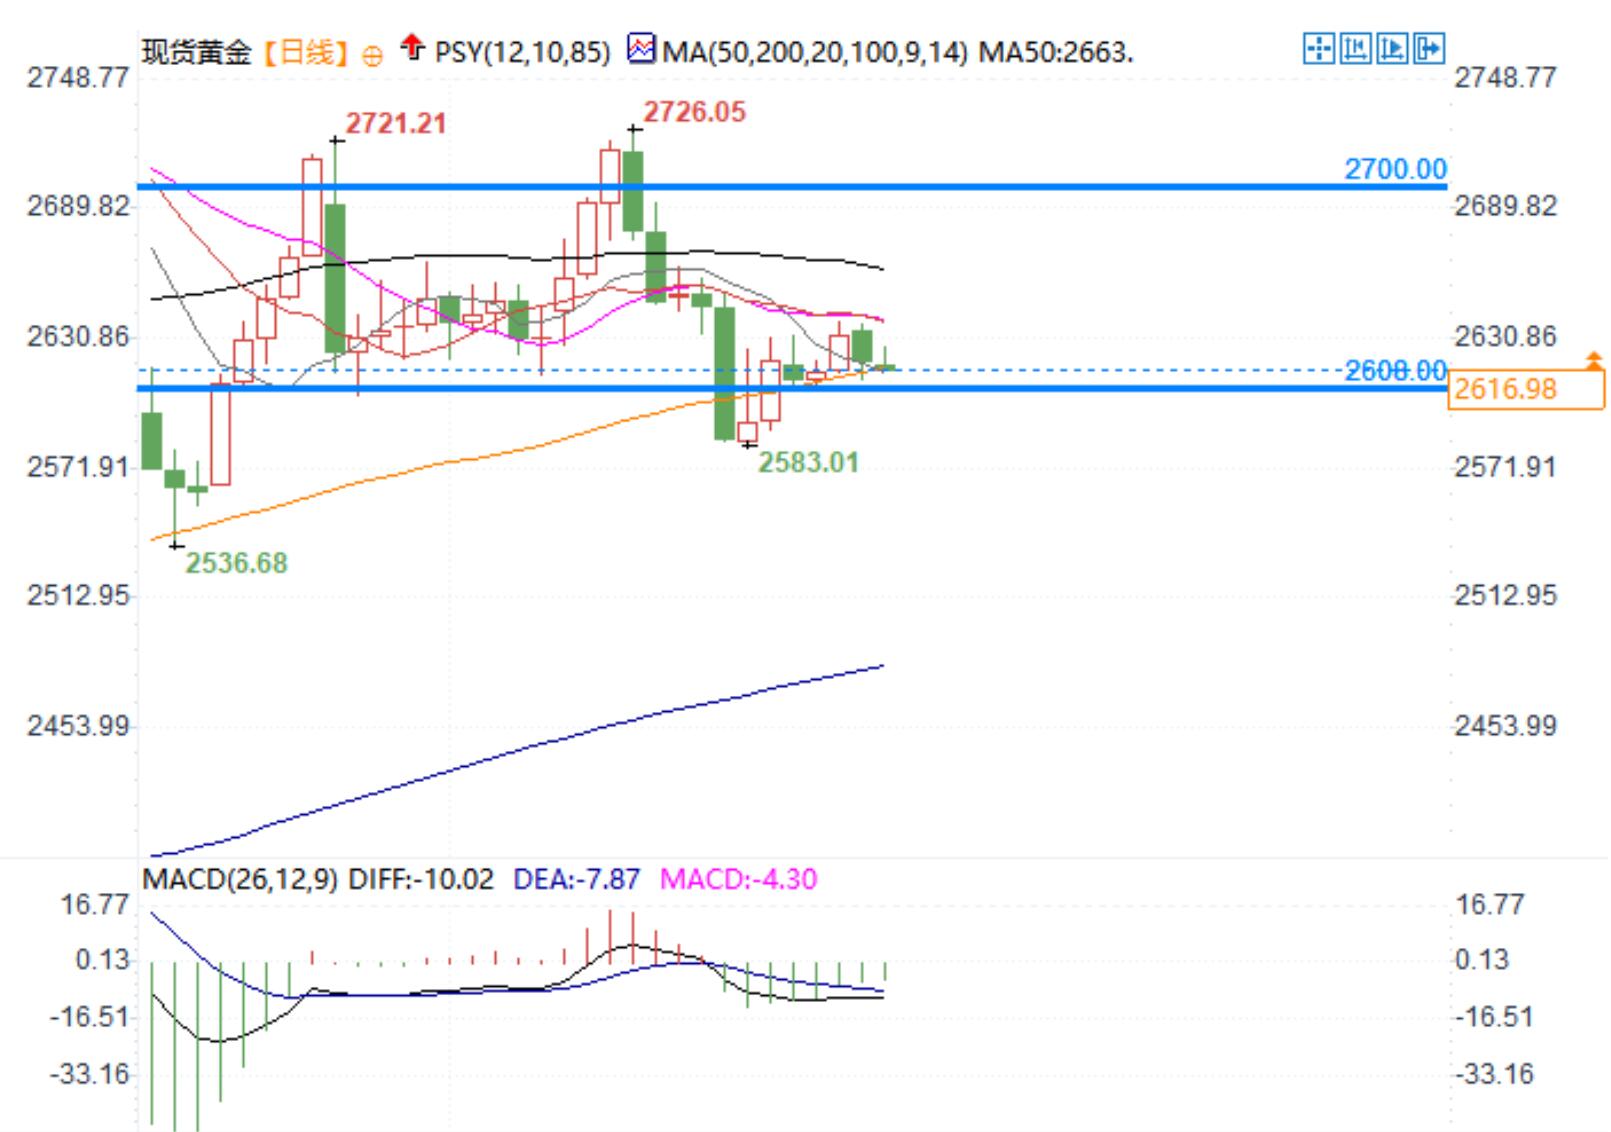
At the beginning of the European market on Monday (December 30th), the gold price has been consolidating around $2620 so far. The gold price has recently rebounded slightly from its stage low, but due to the approaching New Year holiday, the market trading volume is relatively light.
The market expects that the policies that the Trump administration may adopt will exacerbate risk sentiment, which may increase the demand for safe haven gold. With the increasing uncertainty in the global economy, gold, as a traditional safe haven asset, has once again been favored by the market. However, the prospect of the Federal Reserve reducing the frequency of interest rate cuts in 2025 may limit the upward potential of gold. The market will closely monitor the economic data of the United States and the monetary policy movements of the Federal Reserve in the coming months.
In addition, the price of gold is also supported by geopolitical risks caused by the escalation of tensions in the Middle East region. Last Sunday, the Israeli army attacked two hospitals in northern Gaza, resulting in at least 7 deaths and multiple serious injuries. With the intensification of global geopolitical risks, market risk aversion may further push up gold prices. At the same time, global central banks, especially those in emerging markets, have continued to increase their holdings of gold reserves, which is also one of the important factors driving the recent rebound in gold prices.
The gold price is expected to end 2024 with an annual increase of 27%, which is also the best annual performance since 2010. This upward trend is mainly driven by the increase in central bank gold purchases, the escalation of geopolitical tensions, and the monetary easing policies implemented by major central banks. Analysts point out that the gold bull market in 2024 not only reflects an increase in safe haven demand, but also indicates a cautious attitude towards the uncertainty of the future economic situation and monetary policy direction in the market.
Meanwhile, the US dollar index is hovering around 108.00, slightly below its highest level since November 2022. The market is still digesting the hawkish shift of the Federal Reserve, which lowered its benchmark interest rate by 25 basis points at its December meeting. The latest dot matrix chart shows that there may be two interest rate cuts next year. In addition, on Monday, the US two-year and 10-year treasury bond bond yields were 4.32% and 4.62% respectively, which may support gold.
The Federal Reserve has made it clear that it will take a more cautious stance on additional interest rate cuts in 2025, marking a shift in its monetary policy stance. This development highlights the uncertainty of future policy adjustments, especially under the expected economic strategy of the Trump administration. The key to the future trend of the gold market will depend on the development of global economic data and geopolitical situations.
In terms of technology, analyst Faruqui provided the following interpretation:
On Monday, the gold price fluctuated around $2620.00, and the daily chart shows that the gold price is currently in a consolidation phase, approaching the 9-day and 14 day moving averages. On the 14th, the Relative Strength Index (RSI) hovered below 50, reflecting a neutral market sentiment. If RSI can break through the 50 level, it may indicate an increase in market interest in buying gold.
In terms of resistance, gold prices may first target the psychological level of $2700.00, with further resistance at the monthly high of $2726.34 recorded on December 12th. This level is an important target for bulls to conquer recently, and if it breaks through, it may trigger a new round of buying frenzy. In addition, the trend of gold prices in the medium term is still guided by technical indicators, and if bulls can hold onto the current support level, they will have the opportunity to further challenge higher resistance.
In terms of support, gold prices may find initial support at $2608. If it falls below this level, selling pressure may increase, pushing gold prices down to a lunar low of $2583.39. If the gold price further falls below this support, it may trigger more technical selling pressure, causing the price to fall into lower support areas. The market needs to pay attention to the possibility of increased volatility.
Technical analysis also indicates that the gold market is currently in a critical consolidation phase and may continue to fluctuate within a range in the short term. If the gold price can break through the current consolidation zone, market sentiment may quickly turn bullish. In the coming weeks, changes in technical indicators will provide more guidance for the market, especially whether gold prices can steadily break through short-term resistance levels and further challenge historical highs.

Tips:This page came from Internet, which is not standing for FXCUE opinions of this website.
Statement:Contact us if the content violates the law or your rights
