12.30 Analysis of Gold, Silver, and Crude Oil Market Trends
Analysis and interpretation of today's spot gold market:
1, the level of the golden weekly line: The weekly video points out that in the medium term, there is still a tendency to oscillate and continue to correct, as prices are operating below the trend resistance line, and the 5-moving average is still suppressed. MACD also continues to increase volume on the green column; But in order to effectively open up the downward space, we need to break through the middle track, which moved up 2616 this week. We lost some ground on Monday today, but we still need to wait for the closing line this week to confirm;

2, the level of the golden daily chart: it is still judged based on the gains and losses of the 2630 line, which is the bottom pressure point of the previous parallel oscillation interval. The specific chart can be viewed in the weekly video; As long as 2630 cannot effectively break through the station, the short-term trend tends to maintain a weak range of oscillation between 2630-2580; As for what effectiveness is, as mentioned in the previous video, there are generally two main situations: one is when the closing of the big positive is far above the key position, and the other is when the closing of the consecutive positive is above the key position; At present, neither of these has appeared yet, and last Thursday's yang was only punctured, while on Friday it was swallowed up by a bearish candlestick. Therefore, today's trend is to continue to fluctuate and be bearish;
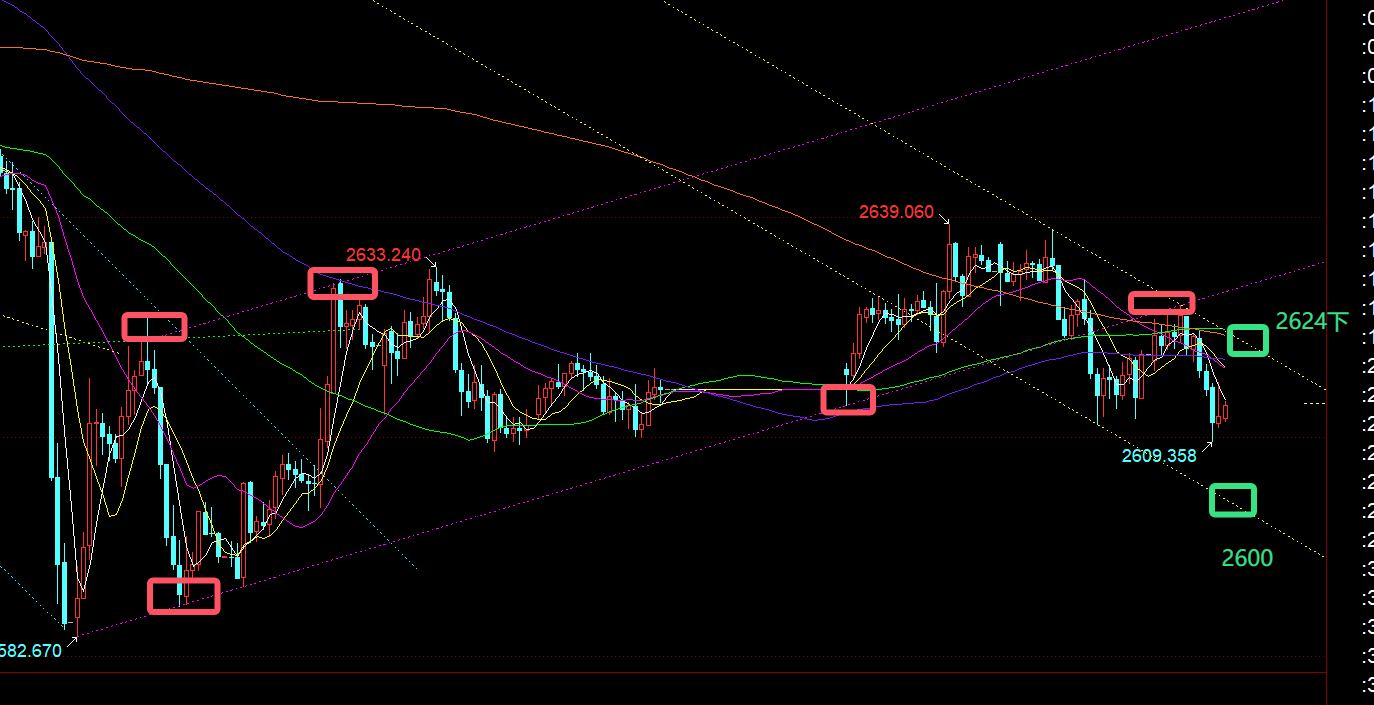
3, the 4-hour level of gold: this cycle focuses on the gains and losses of the 10 moving average. For volatile markets, the gains and losses of the 10 moving average are a sign of strength and weakness changes; Operating on the 10th, with strong oscillation; On the 10th, the oscillation is weak and running; At present, the resistance of the 10 moving average is at 2624. Tonight, it will remain weakly suppressed at this level;
4, the level of the golden hourly line: Last Friday's consecutive bearish trend in the US market has effectively fallen below the purple channel in the chart. Early today, it rebounded and confirmed the anti pressure point. After effective pressure, 2628 launched a wave of decline, breaking through the low of 2611 last Friday and reaching the low of 2609-08, which was volatile last week; So as the high and low points gradually move downwards, the focus also slowly shifts downwards, forming a new yellow downward channel. Tonight, pay attention to the resistance of the upper track at 2620-24, and continue to be bearish even when under pressure. The lower track points to the 2600 line;
Spot Silver
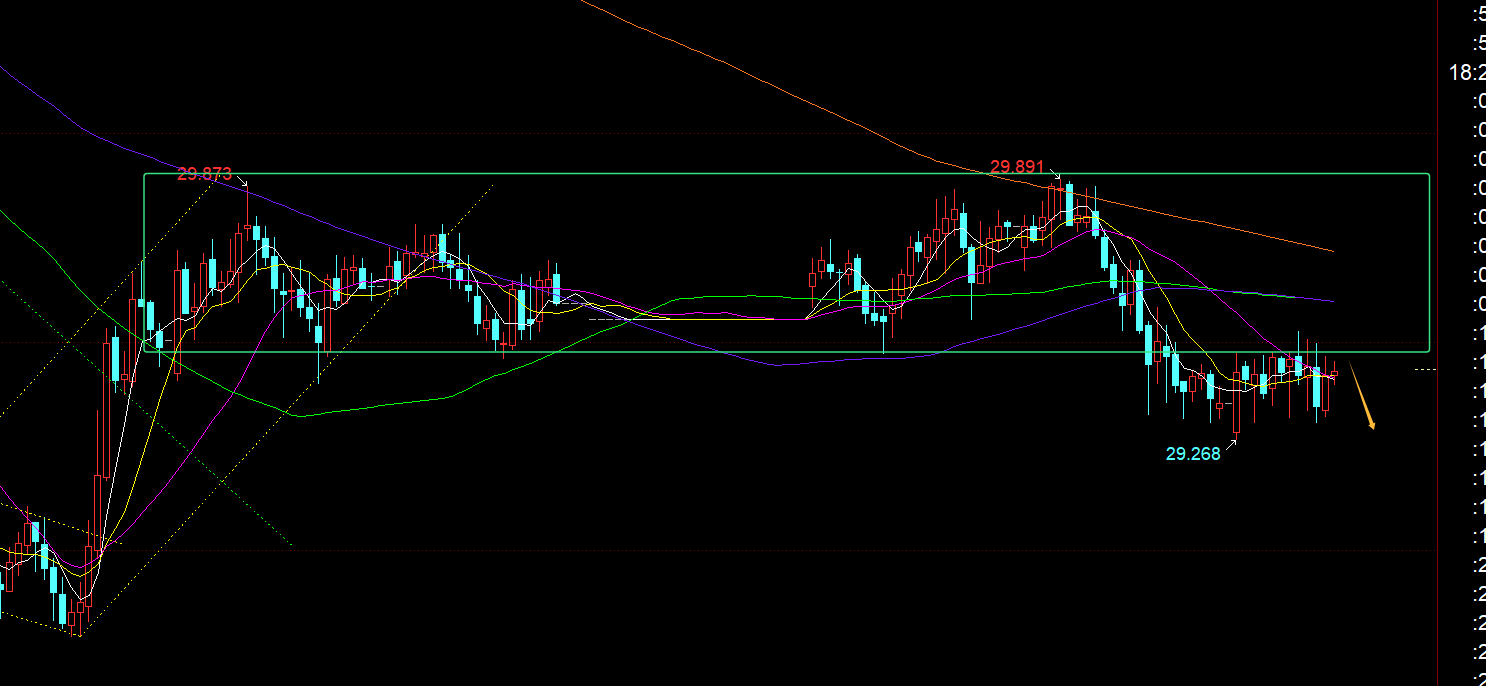
 Last Friday, the daily chart closed with a strong bearish trend, swallowing up the previous day's bullish trend. Its form is weaker than gold, and today's short-term moving average is under pressure at 29.55; In addition, the parallel box channels in the figure have also broken through, with the 29.45 line becoming a counter pressure point. Tonight, pay attention to the continued oscillation and bearish trend below 29.55, supporting 29.25, 29, 28.67, etc; The two supports mentioned in the weekly video, daily and weekly, can be noted for stabilization;
Crude oil:
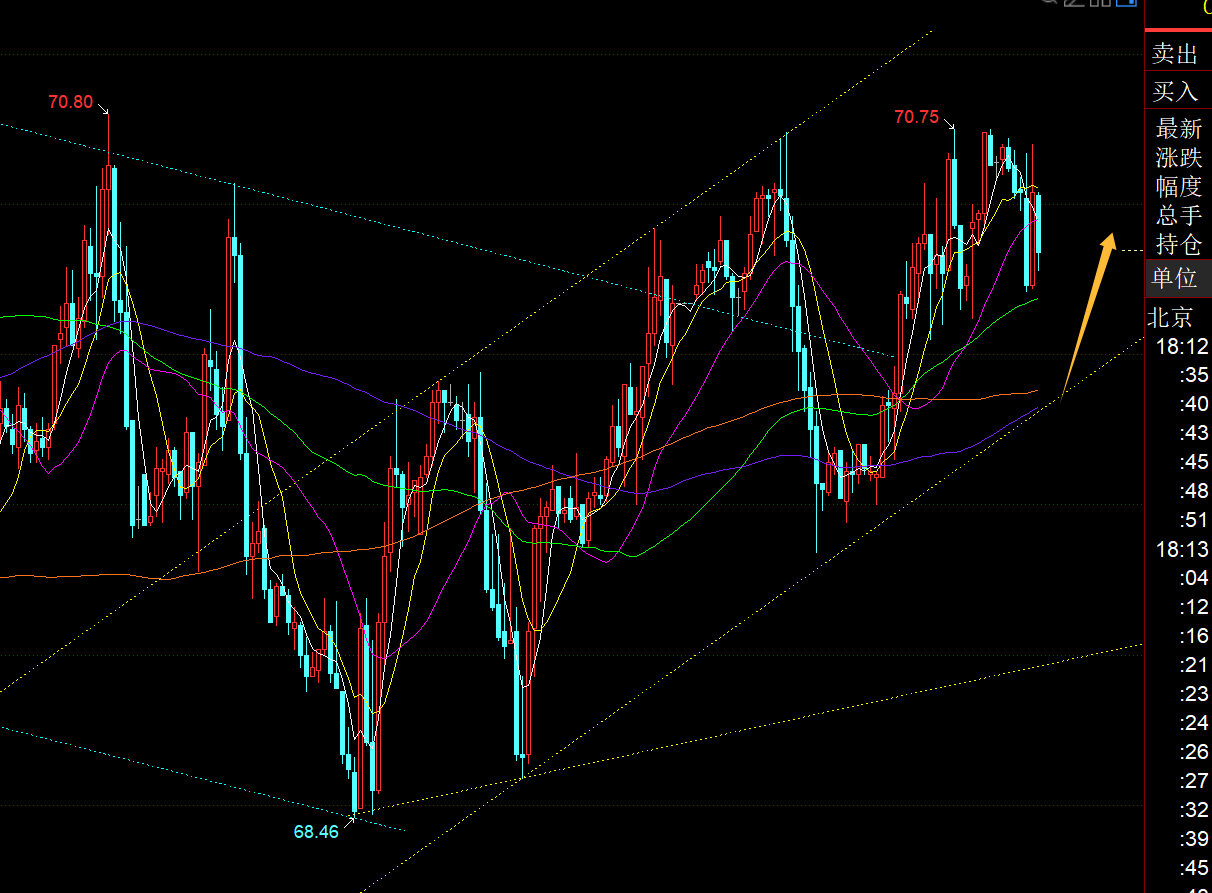
 Crude oil always maintains fluctuations, and its continuity is poor; From the chart below, it can be seen that the current trend is oscillating and rebounding in the upward channel. Tonight, we will pay attention to the support of the lower track at 69.8 and stabilize and rebound at the upper track at 71.4, while the upper track is under pressure and bearish;
Tips:This page came from Internet, which is not standing for FXCUE opinions of this website.
Statement:Contact us if the content violates the law or your rights
