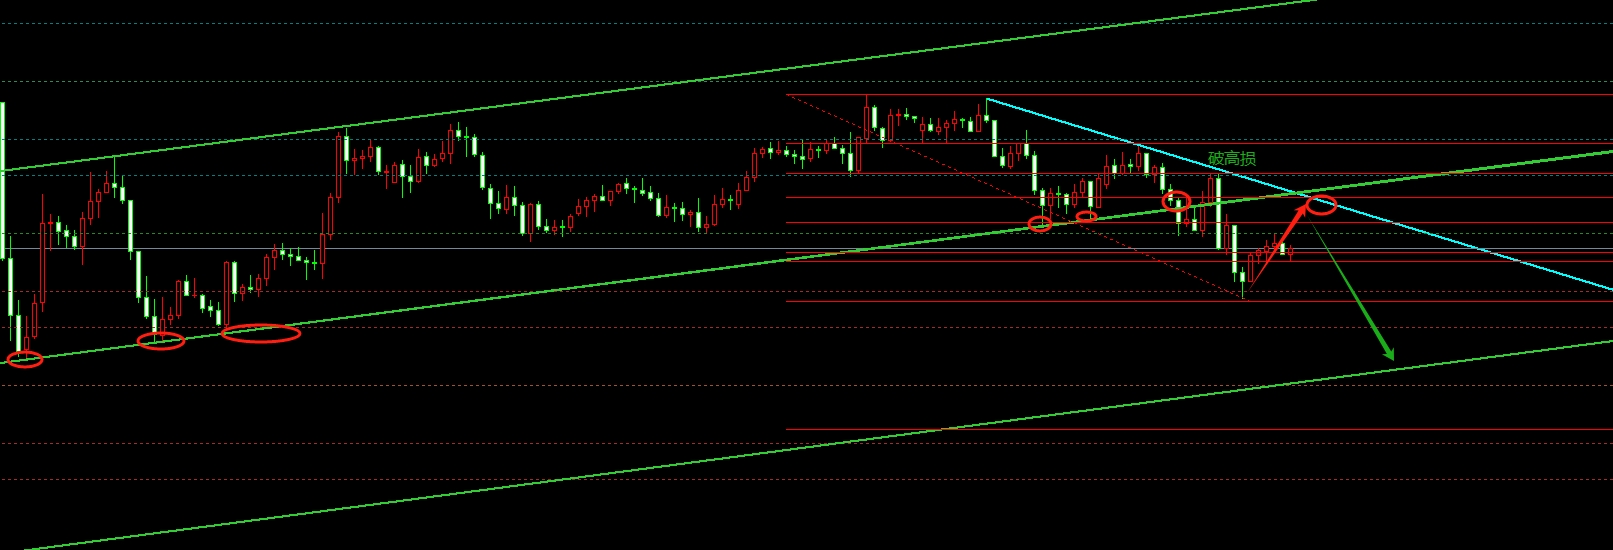
12.31 Gold breaks bottom and continues to decline, with short selling continuing at 2618 during the day
Yesterday, we continued Friday's decline and saw a volatile drop in prices. In fact, the intraday trend was the same as Friday's, with prices first returning to the trend line and then rebounding, creating a secondary decline near the counter pressure. After breaking the trend line, the price broke through the break and went down. However, we bought one more wave at 2610.7 during the day, reaching a peak of 2622. The 2624-25 short market we gave almost fell short, and after breaking 13, we opened a short market and gave a target of 02-96. Almost all of us gave the target level, and from Friday to yesterday, we basically followed the rhythm of top bottom transition, breaking the level and then withdrawing before falling again. Looking at today, the price fell below the upward channel of 2583, rebounding 2639, and entered a new downward trend in the short term. From a graphical perspective, the intraday rebound suppression refers to the lateral pressure since the 2639 decline, with the 50 level 2617 line between 2596-2639, And below are still the low points from last night, the daily chart bottom line, and the previous low points. Once it falls below, it means that the overlapping moving average of the weekly chart will also break, which is a big deal. However, it is also possible to rebound without breaking the double bottom. Therefore, overall, we will continue to take advantage of the rebound pressure and enter the market with a 5-minute signal.

In terms of operation, the rebound of 2617-18 is accompanied by a five minute short selling signal to enter the market, with support below 2610-2596-88-80 breaking the level to see 2560
GBP/JPY: Yesterday, there was no continuation of the upward trend, but the price rose to near the four hour acceleration line, forming a sharp drop. The daily chart showed a large bearish line. Today, after the hourly chart is corrected, it will enter the market with a 5-15 bearish signal. The reference pressure for the point is 197.8-198
Oil: Yesterday's price of 69.5 was not high enough, and the short price of 71.65 given in the evening was also slightly off. From the daily chart, it is still high, but it is close to the pressure intensive area of the daily chart. Today, we are focusing on the suppression of 71.85-72, rising and falling below 71.5, rebounding 0.2, entering the short market, with a new high loss.
The above ideas are for reference only. There are risks in the market, and investment needs to be cautious.
Trading is for profit, not for gambling or trading, so traders must understand what actions to take when the price is at a certain stage! Traders are not always long or short, they always change with the market! Traders must have their own defense system to control risks! Risk control and fund management are essential in your trading!
Tips:This page came from Internet, which is not standing for FXCUE opinions of this website.
Statement:Contact us if the content violates the law or your rights
