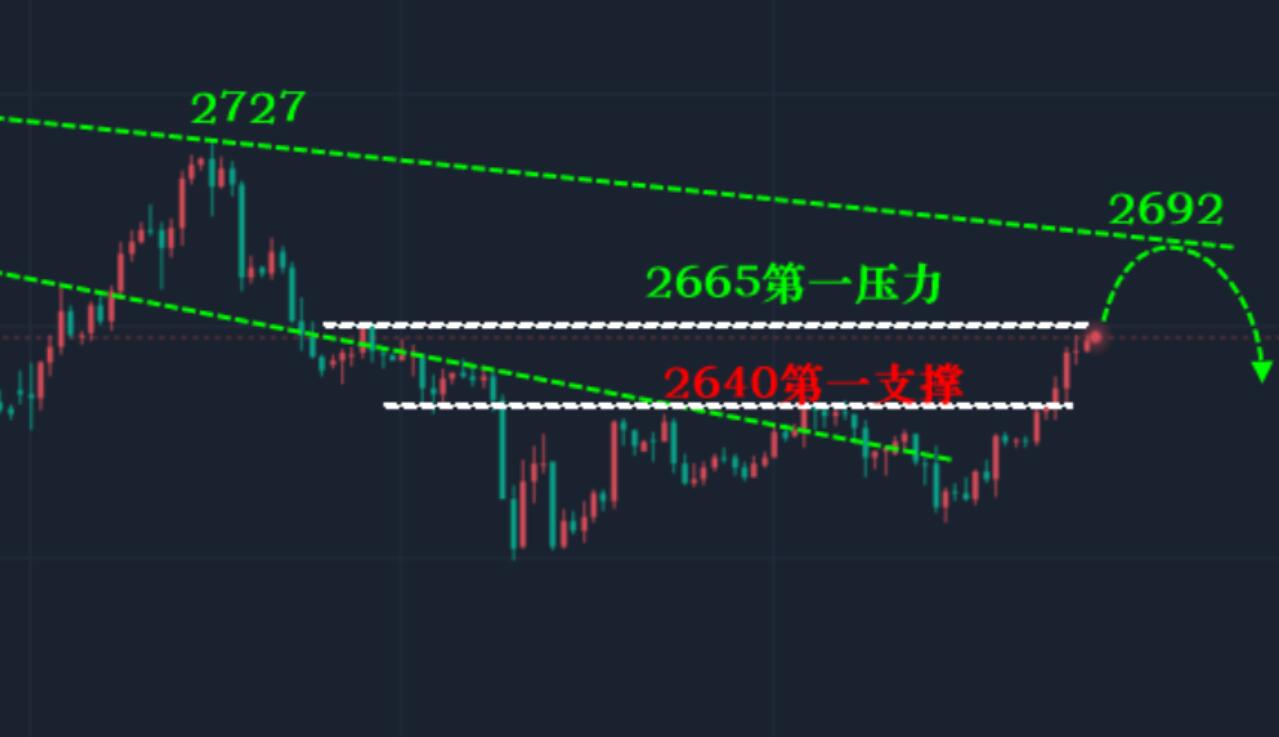
Gold price pierces up and down, oscillating downwards without changing the range!
Analysis of spot gold technology trend chart:
1: Within the range of 2695-2585 in daily K, a typical oscillating trend is formed; The boundary between strength and weakness is at 2640/45; If stability cannot be achieved, the range of 2645-2585 should still be followed; If it stabilizes above 2645, it will still follow the range of 2645-2695; Within the interval, the position of 2645 can be used as the strong weak watershed, and the intraday long short watershed can be processed accordingly;
2: Within 4 hours, a temporary upward and downward puncture trend is formed; The random indicator temporarily crosses upwards, indicating multiple main signals; However, in terms of form, it is currently a bearish oscillation running downwards; Support position 2610 below; The pressure position above 2660 can be treated as a daily interval; At the same time, combine the strong and weak boundary point 2645 of daily K to handle it;

Short term buying near card 2610 during the day, see if buying support is temporarily effective; And the pressure positions 2645 and 2660/65 above, with short selling and effective game pressure, will continue to be treated as oscillations;
Tips:This page came from Internet, which is not standing for FXCUE opinions of this website.
Statement:Contact us if the content violates the law or your rights
