Technical analysis of gold, silver, and the US dollar
Before the release of non farm payroll data in the United States, the US dollar index remained strong. Concerns about President elect Trump's inflationary policies have intensified the rise in global bond yields, widening the gap between the United States and other countries. This difference supports the US dollar and increases the volatility of foreign bond markets.
The recent surge in US Treasury yields, with the 10-year benchmark yield reaching a 9-month high of 4.728%, has put pressure on gold prices. The market is now waiting for the release of non farm employment and unemployment data. The chart highlights the fluctuations of non farm payroll employment and unemployment rate over time in the United States, indicating an increase in unemployment rate since 2023, suggesting a possible cooling of the labor market.
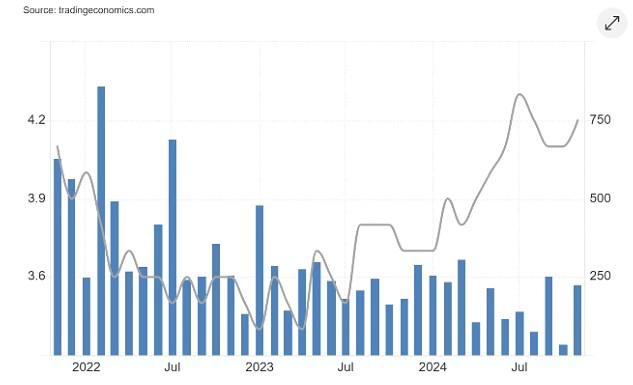
Figure 1: The blue bar represents non farm payroll employment in the United States, while the thin line represents the unemployment rate in the United States
These trends indicate that the US economy is facing challenges in maintaining strong job growth. A weak labor market may suppress consumer spending and slow down economic activity, which could put pressure on the US dollar. The market expects non farm employment to increase by 154000 in December and 227000 in November. In addition, geopolitical tensions, such as the Russia-Ukraine conflict and the turmoil in the Middle East, have further increased the complexity of the market.
Golden Daily Chart - Rising and Widening Wedge
The daily chart of gold shows that the price of gold has rebounded from the support level in an upward wedge-shaped expansion pattern. The gold price is still in a bullish trend, indicating the potential for further increase. The price forms a symmetrical triangle within this pattern, indicating the continuation of a positive trend. With the release of today's non farm payroll data, the strong resistance level is expected to be at $2720, which must be cleared before a meaningful upward trend can begin. On the downside side, gold prices must fall below $2550 to show further bearish momentum.
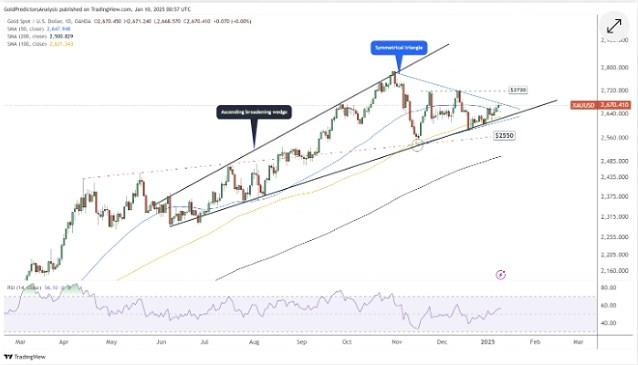
Figure 2: Gold Daily Chart
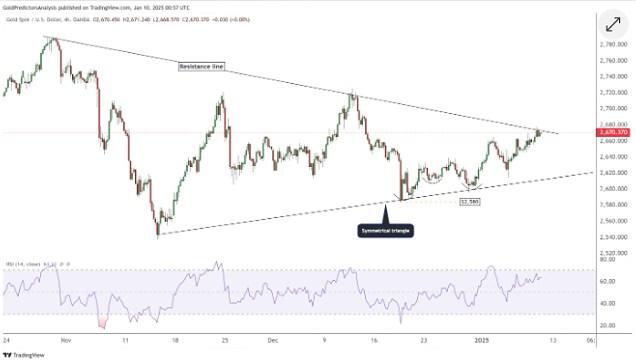
Figure 3: 4-hour chart of gold (gold prices remain within a symmetrical triangle and consolidate near the apex of the form)
Silver Daily Chart - Wedge Shape of Decline
The silver daily chart shows the formation of a wedge-shaped downward trend, which is usually considered a bullish signal. The silver price closed above the 200 day moving average and consolidated near the resistance level of the downward wedge. In addition, the silver price has formed a double bottom at the wedge-shaped support level, highlighting its bullish potential.
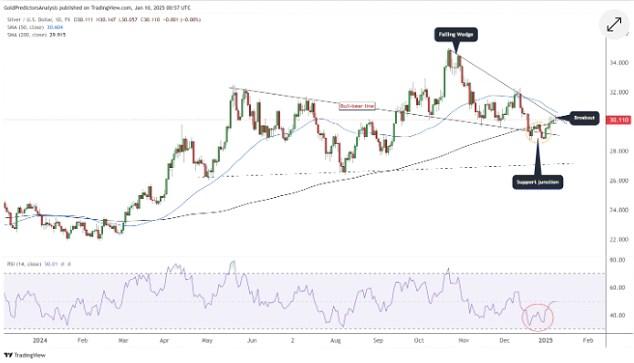
Figure 4: Silver Daily Chart
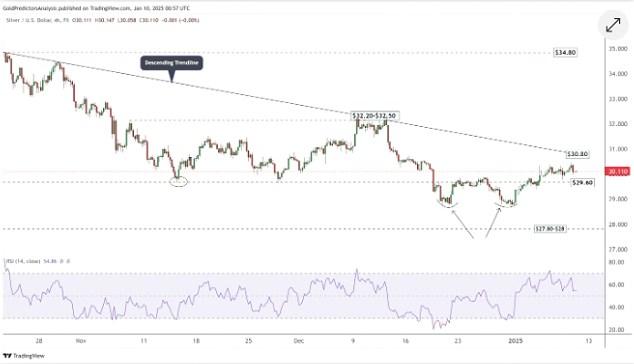
Figure 5: 4-hour chart of silver (downward trend line)
Daily chart of the US dollar index - see the upward trend
The daily chart of the US dollar index shows an upward trend above the key level of 109. The index is currently above 109, showing strong performance before the release of employment data. The 50 day moving average is still above the 200 day moving average, indicating a strong bullish trend. The key support level for this index is still at 107.
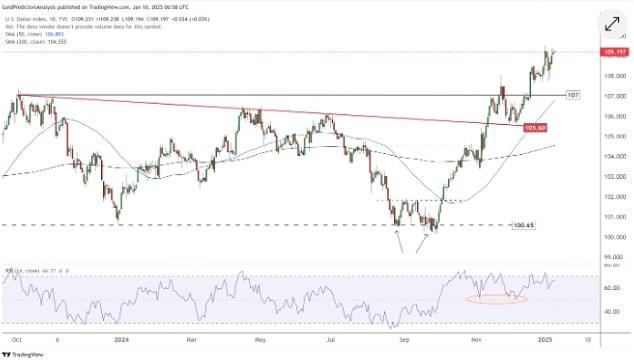
Figure 6: Daily chart of the US dollar index
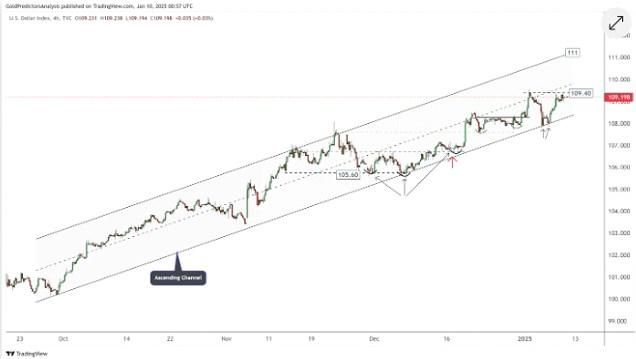
Figure 7: 4-hour chart of the US dollar index (upward channel)
Tips:This page came from Internet, which is not standing for FXCUE opinions of this website.
Statement:Contact us if the content violates the law or your rights
